. 2017 Oct;7(10):1136-1153.
doi: 10.1158/2159-8290.CD-17-0399. Epub 2017 Jul 20.

Superenhancer Analysis Defines Novel Epigenomic Subtypes of Non-APL AML, Including an RARα Dependency Targetable by SY-1425, a Potent and Selective RARα Agonist

Affiliations

Superenhancer Analysis Defines Novel Epigenomic Subtypes of Non-APL AML, Including an RARα Dependency Targetable by SY-1425, a Potent and Selective RARα Agonist

Michael R McKeown et al. Cancer Discov. 2017 Oct.

Abstract

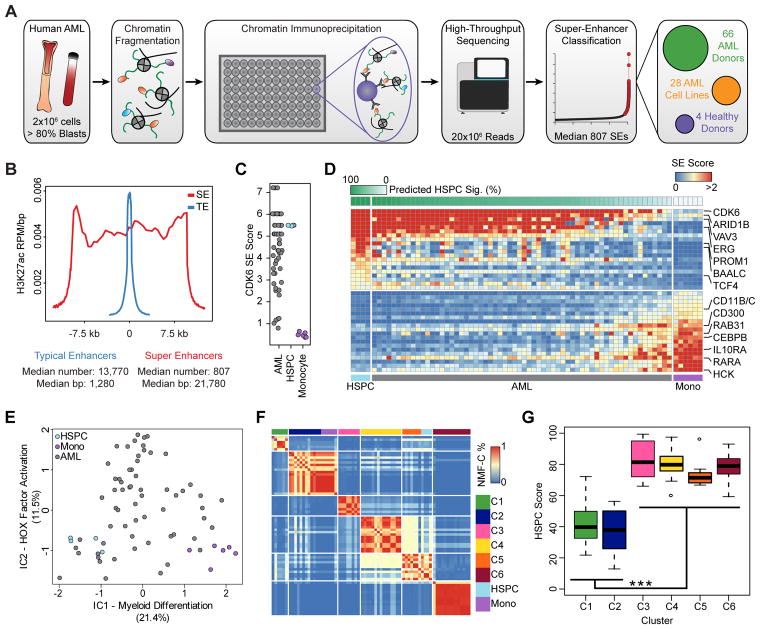
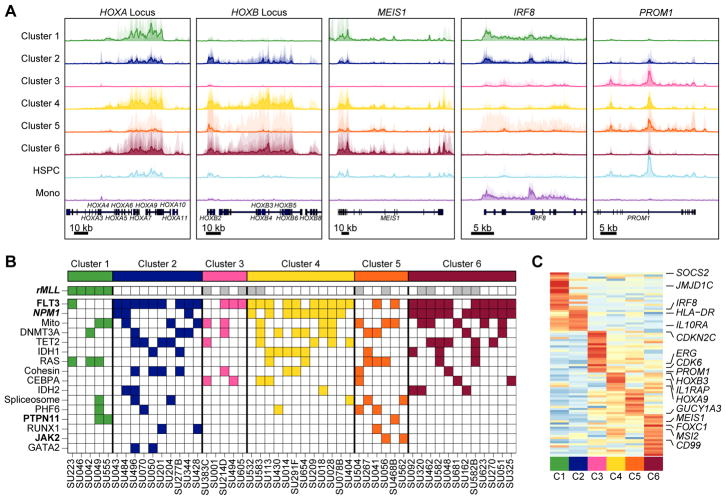
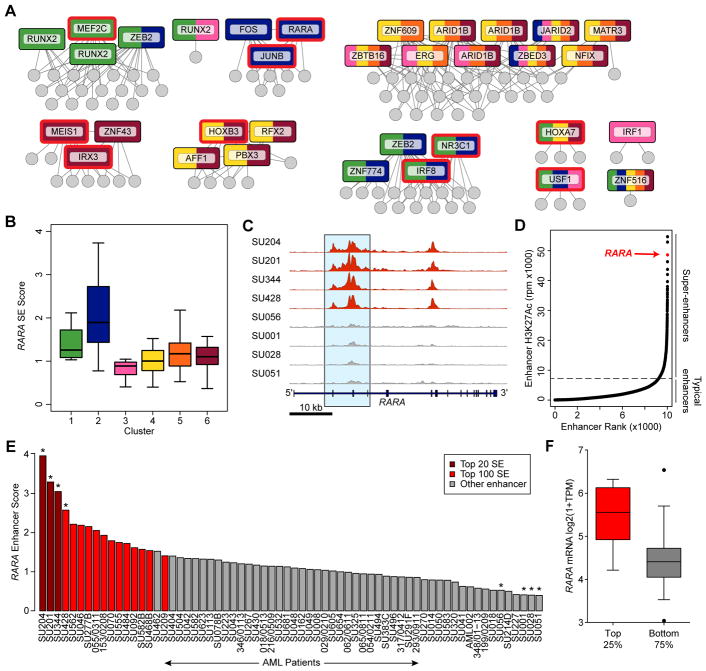
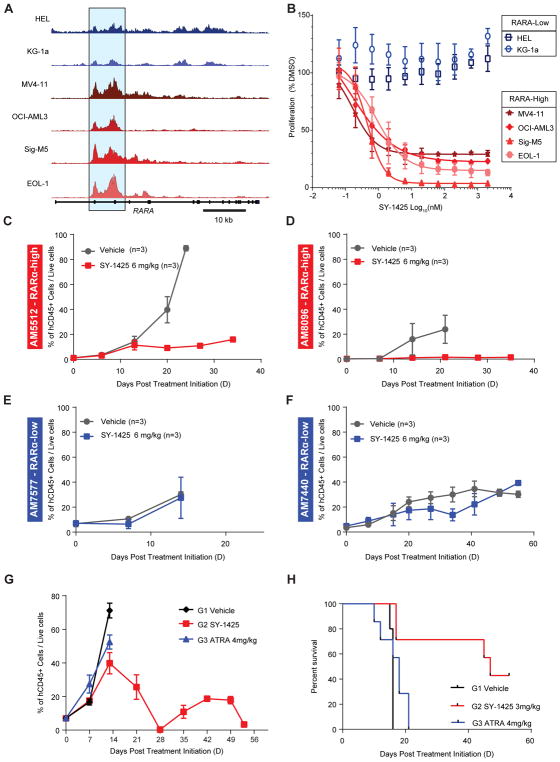
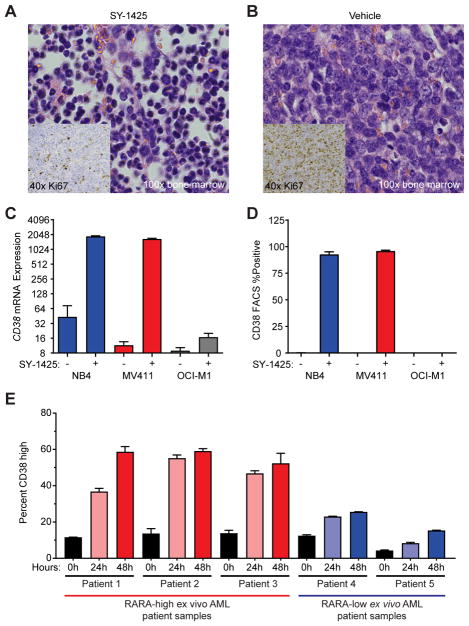
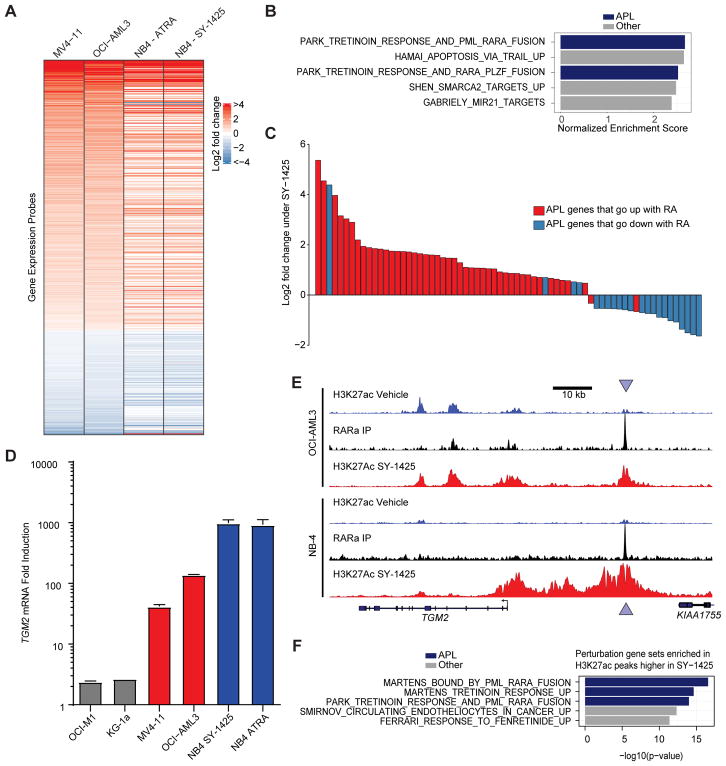
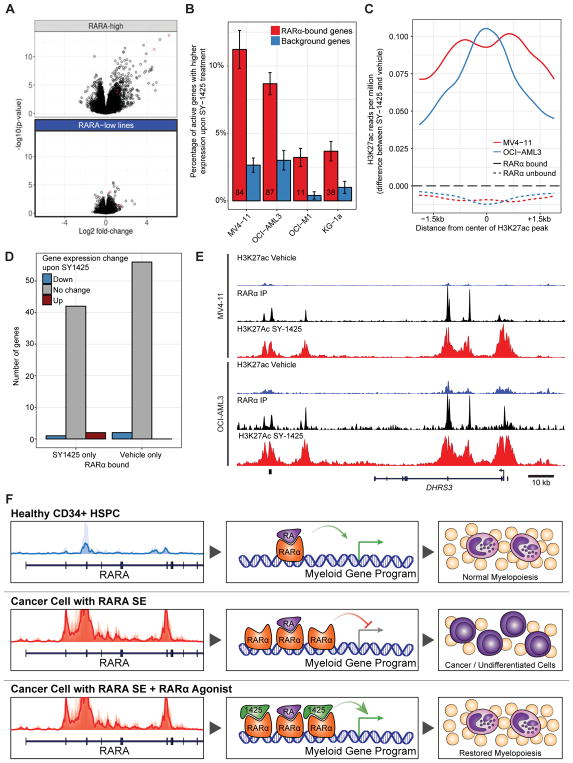
We characterized the enhancer landscape of 66 patients with acute myeloid leukemia (AML), identifying 6 novel subgroups and their associated regulatory loci. These subgroups are defined by their superenhancer (SE) maps, orthogonal to somatic mutations, and are associated with distinct leukemic cell states. Examination of transcriptional drivers for these epigenomic subtypes uncovers a subset of patients with a particularly strong SE at the retinoic acid receptor alpha (RARA) gene locus. The presence of a RARA SE and concomitant high levels of RARA mRNA predisposes cell lines and ex vivo models to exquisite sensitivity to a selective agonist of RARα, SY-1425 (tamibarotene). Furthermore, only AML patient-derived xenograft (PDX) models with high RARA mRNA were found to respond to SY-1425. Mechanistically, we show that the response to SY-1425 in RARA-high AML cells is similar to that of acute promyelocytic leukemia treated with retinoids, characterized by the induction of known retinoic acid response genes, increased differentiation, and loss of proliferation.Significance: We use the SE landscape of primary human AML to elucidate transcriptional circuitry and identify novel cancer vulnerabilities. A subset of patients were found to have an SE at RARA, which is predictive for response to SY-1425, a potent and selective RARα agonist, in preclinical models, forming the rationale for its clinical investigation in biomarker-selected patients. Cancer Discov; 7(10); 1136-53. ©2017 AACR.See related commentary by Wang and Aifantis, p. 1065.This article is highlighted in the In This Issue feature, p. 1047.


Conflict of interest statement

Disclosure of Potential Conflicts of Interest

MRM, MLE, CF, EL, JTL, MGG, MWC, DS, DO, JTL, KA, and CCF are shareholders of Syros Pharmaceuticals. MRC, SMC, JLK and RM have no conflicts of interest to report.

Figures

Figure 1
Figure 1
Identification, refinement, and clustering of cancer-specific super-enhancers in human AML. A, Schematic of the high-throughput chromatin immunoprecipitation pipeline used to generate super-enhancer maps in human AML and normal blood cells. B, Metapeak representation of typical (TE - blue) and super (SE - red) enhancers in a single AML patient (SU223). H3K27ac ChIP-seq read density was calculated in each of 40 bins across each enhancer type (either typical or super) and plotted as the median enhancer width (21.7 kb), in addition to 40 bins in the 3kb upstream and 40 bins in the 3kb downstream of the enhancer. Reads in each bin were normalized by the total reads in the experiment (in millions) and to the size of the bin in base pairs. The average normalized read density in each bin across all SEs or TEs was plotted, and the x-axis was normalized by the relative median widths of SEs or TEs. C, Quantification of the SE linked to CDK6 for AML (top, gray), HSPC (middle, light blue), and monocyte (bottom, purple) samples. Ties are due to quantile normalization as CDK6 often has one of the top 4 strongest super-enhancers genome-wide. D, The twenty most HSPC-associated and the twenty most monocyte-associated SEs were used to estimate an HSPC signature through non-negative least squares. Primary AML samples are ordered by this estimated HSPC signature (top, green bar). The heatmap depicts SE scores for the HSPC-associated and monocyte-associated SEs used in the classification. E, Independent components analysis of SE data from AML, HSPCs, and monocytes. F, Heatmap shows the NMF consensus clustering distance (fraction of NMF iterations in which a pair of samples were grouped in the same cluster; blue - low, red - high) between each sample in this study. HSPCs (light blue) and monocytes (purple) are projected into the clustering without being allowed to contribute to the NMF. G, The estimated HSPC signature score (y axis) for each SE-based cluster is shown (*** p < 3×10⁻⁸).
Figure 2
Figure 2
Super-enhancer-derived patient subgroups associate with genotype and survival. A, Metatrack plots for cluster-specific super-enhancer loci. Each individual sample in a cluster is shown as a transparent area plot and the median profile is represented over top by a thick line. The height of a given sample’s profile is determined by creating an H3K27Ac read density within the region and then scaling it to half the height of a similar region around MALAT1. B, AML samples were genotyped by either exome sequencing or targeted capture sequencing. Somatic non-synonymous mutations passing stringent filters (see methods) are displayed as colored blocks. Gray blocks indicate that the mutational status of that gene in the given patient is unknown. White blocks indicate that a mutation in that gene does not exist in the given patient. A bold mutation name indicates a nominally significant association (p < 0.05) between the mutation and the clustering (Fisher’s exact). Similarly, bold and italic font indicates significance after multiple hypothesis testing correction (p < 0.001). Only the most recurrent mutations (n > 2) are shown here. rMLL = MLL rearrangement; Mito = Mitochondrial genes. C, Cluster-specific SEs were determined by identifying the SEs with the largest dynamic range in the NMF basis matrix. The heatmap visualizes these 88 SEs as their median SE score per cluster (row normalized) and key linked genes are highlighted.
Figure 3
Figure 3
A subset of AML patients have a super enhancer at the RARA locus. A, Mutual information network of the SE score between cluster-specific SEs. SEs that are linked to TFs are named and displayed in boxes, with edges to the SEs with which they have high mutual information. Each box is colored by its contribution to each cluster, with multiple clusters indicated by color stripes. TFs with motifs that are enriched in SEs specific to the clusters indicated here over active background regions are outlined in red. Non-TF-linked SEs are indicated as gray circles. B, Boxplot showing the score of the RARA SE (y-axis) and corresponding cluster median (black bar), grouped by cluster membership (x-axis). C, H3K27ac ChIP-seq tracks at chr17:38,464,514–38,515,430 with large SEs shown in red and non-SE tracks shown in gray. D, Rank ordering of enhancers in a single patient sample (SU204). The SE linked to the RARA locus is indicated and is the third largest enhancer in this sample. E, Distribution of enhancer scores for the RARA enhancer across the 66 non-APL AML patient cohort. Crimson indicates samples where the RARA SE is amongst the top 20 largest enhancers in the sample; red indicates the same for the top 100 enhancers; gray is for remaining samples. The asterisks indicate the samples shown in the plot in (C). F, RARα mRNA levels (assessed by RNA-seq) in patient samples with differential RARA enhancer score. The top 25% of samples by enhancer score contain significantly higher RARα mRNA levels (p<0.0001, two tail T-test with Welch’s correction).
Figure 4
Figure 4
The presence of a RARA SE correlates with sensitivity to SY-1425 in non-APL AML cell lines and PDX models. A, H3K27ac tracks at the RARA locus for RARA-low cell lines in blue (HEL, KG1a) and RARA-high in red (MV411, AML3, EOL1, SigM5). Blue highlighted region indicates the RARA SE. B, Anti-proliferative response of non-APL AML cell lines to SY-1425 as assessed by ATPlite (PerkinElmer) for 2 RARA-low (blue) and 4 high (red). C, Effect of SY-1425 in AM5512 non-APL RARA-high PDX model. Tumor growth was monitored by measuring human CD45 positive cells in mouse circulation with treatment initiated 30 days after inoculation. D, Effect on percent human CD45 positive in peripheral blood of SY-1425 in AM8096 non-APL RARA-high PDX model. Treatment was initiated 43 days after inoculation. E, AM7577 non-APL RARA-low PDX model showing days post treatment initiation versus percent positive cells for human CD45. Treatment was initiated 36 days after inoculation. F, AM7440 non-APL RARA-low PDX model showing days post treatment initiation versus percent positive cells for human CD45. Treatment was initiated 105 days after inoculation. G, Comparison of ATRA (blue) with SY-1425 (red) and vehicle (black) in AM5512 non-APL RARA-high PDX model. Treatment was started 23 days after inoculation Mice were treated with 3mg/kg BID for SY-1425 or 4mg/kg BID for ATRA. H, Survival plot for study in (G) SY-1425 treated (red), ATRA (blue), or Vehicle (black). SY-1425 shows significant prolongation of survival (0.02 Mantel-Cox test).
Figure 5
Figure 5
SY-1425 induces maturation in RARA-high AML. A–B, Histology from bone marrow for (A) SY-1425 treated and (B) Vehicle treated. H&E staining of bone marrow from mice at day 14 of treatment shown at 100x. Inset on each image is Ki67 staining from the same bone marrow and time at 40x. C, CD38 mRNA expression analyzed by microarray in an APL cell line (NB4 – blue), a RARA-high cell line (MV-411 – red), and a RARA-low cell line (OCI-M1 - gray). Error bars represent standard deviation of three biological replicates. D, CD38 protein expression analyzed by flow cytometry in an APL cell line (NB4 – blue), a RARA-high cell line (MV-411 – red), and a RARA-low cell line (OCI-M1 - gray). Error bars represent standard deviation of three biological replicates. E, Plot of CD38 high induction for three RARA-high AML patients (left, red) and two RARA-low (right, blue) at indicated time points. Samples were mononuclear cells from AML patients tested for ex vivo response to 50nM SY-1425.
Figure 6
Figure 6
SY-1425 shows similar response in RARA-high AML cell lines to APL. A, Gene expression response to SY-1425 (log2 fold-change) by Affymetrix probes in the APL cell line NB-4 and the RARA-high cell lines OCI-AML3 and MV4–11. Probes with FDR<0.01 in joint group of OCI-AML3 and MV4–11 (n=575) are shown. Probes are sorted by log2 fold-change in joint group of OCI-AML3 and MV4–11. B, Gene sets from the perturbation gene sets (MSigDB C2.CGP) that are enriched by GSEA in SY-1425 response in the RARA-high cell lines (top 5 gene sets by FDR, all of which are FDR<0.01). Gene sets referencing Tretinoin (ATRA) or APL are indicated in blue. X-axis indicates normalized enrichment score (NES). C, Log2 fold change of genes in RARA-high AML cell lines (OCI-AML3 and MV4–11) upon SY-1425. The 69 genes differentially expressed in both the RARA-high AML cell lines upon SY-1425 and the ex-vivo APL patient samples upon retinoic acid treatment (Meani et al. 2005) are shown. Colors indicate the direction of change in the APL patient samples. D, Gene expression fold induction of TGM2 by SY-1425 (AML cell lines) or SY-1425 and ATRA (NB-4). Gray bars indicate RARA-low lines, red bars indicate RARA-high lines, and blue bars indicate the APL cell line. E, H3K27ac and RARα ChIP-seq signal at the TGM2 locus (chr20:36,749,636–36,841,254) in OCI-AML3 (RARA-high AML) and NB-4 (APL). Arrows indicate RARα binding site. F, GREAT analysis of gene sets enriched in H3K27ac peaks that are up-regulated by SY-1425 in the RARA-high cell lines (OCI-AML3 and MV4–11). Top 5 (by FDR) perturbation gene sets are shown (full data in Supplementary Table S7).
Figure 7
Figure 7
SY-1425 induces transcriptional and epigenetic alterations. A, Volcano plots of gene expression response to SY-1425 by Affymetrix probes in RARA-high cell lines (OCI-AML3, MV4–11, and Sig-M5) and RARA-low cell lines (OCI-M1, KG-1a, Kasumi-1). Red points are probes that map to DHRS3. B, Percentage of genes in each set that are up-regulated by SY-1425 (FDR<0.05 and log2 fold change >1) in each cell line. RARα bound genes contain a RARα ChIP-seq peak (top 4000 peaks per cell line) within the gene regulatory region of the gene (promoter+10kb up to neighboring gene’s promoter). Background genes are drawn from genes with similar expression level to RARα bound genes. Error bars are from bootstrapping. Numbers in the RARα bound bars indicate the number of genes up-regulated and bound by RARα in that cell line. C, Meta-peak of H3K27ac peaks in the RARA-high cell lines by the difference in H3K27ac ChIP-seq reads per million in the SY-1425 and vehicle conditions (positive values indicate more signal in SY-1425 condition). D, Number of genes bound by RARα only in SY-1425 or vehicle conditions in MV4–11 cell line by whether their expression is differential between conditions. E, H3K27ac (blue: vehicle, red: SY-1425 50nM) and RARα (black) ChIP-seq signal at the DHRS3 locus (chr1:12,575,438–12,701,209) in RARA-high cell lines (OCI-AML3 and MV4–11). F, Proposed model of SY-1425 action in RARA-high AML. Normal CD34+ immature myeloid cell track at the RARA locus shows low acetylation leading to a balance of endogenous retinoic acid (RA) and RARα protein preceding normal development of granulocytes (top). Cancer cells with the SE at the RARA locus drive an excess RARα protein causing an imbalance of protein and ligand that favors the repressive form of RARα holding back maturation and enabling proliferation (middle). Treatment with SY-1425 strongly agonizes RARα to re-activate myeloid signaling and cause terminal differentiation of AML cells (bottom).

Comment in

References

    1. Ferrara F, Schiffer CA. Acute myeloid leukaemia in adults. The Lancet. 2013;381:484–495. - PubMed
    1. Surveillance, Epidemiology, and End Results (SEER) Program Populations. National Cancer Institute, DCCPS, Surveillance Research Program; 1969–2015. ( www.seer.cancer.gov/popdata) released December 2016.
    1. Vogelstein B, Papadopoulos N, Velculescu VE, Zhou S, Diaz LA, Kinzler KW. Cancer Genome Landscapes. Science. 2013;339:1546–58. - PMC - PubMed
    1. Chapuy B, McKeown MR, Lin CY, Monti S, Roemer MG, Qi J, et al. Discovery and Characterization of Super-Enhancer-Associated Dependencies in Diffuse Large B Cell Lymphoma. Cancer Cell. 2013;24:777–790. - PMC - PubMed
    1. Lovén J, Hoke HA, Lin CY, Lau A, Orlando DA, Vakoc CR, et al. Selective Inhibition of Tumor Oncogenes by Disruption of Super-Enhancers. Cell. 2013;153:320–34. - PMC - PubMed

MeSH terms