. 2017 Sep 15;77(18):4947-4960.
doi: 10.1158/0008-5472.CAN-17-0114. Epub 2017 Jul 20.

MYC-Regulated Mevalonate Metabolism Maintains Brain Tumor-Initiating Cells

Affiliations

MYC-Regulated Mevalonate Metabolism Maintains Brain Tumor-Initiating Cells

Xiuxing Wang et al. Cancer Res. .

Abstract

Metabolic dysregulation drives tumor initiation in a subset of glioblastomas harboring isocitrate dehydrogenase (IDH) mutations, but metabolic alterations in glioblastomas with wild-type IDH are poorly understood. MYC promotes metabolic reprogramming in cancer, but targeting MYC has proven notoriously challenging. Here, we link metabolic dysregulation in patient-derived brain tumor-initiating cells (BTIC) to a nexus between MYC and mevalonate signaling, which can be inhibited by statin or 6-fluoromevalonate treatment. BTICs preferentially express mevalonate pathway enzymes, which we find regulated by novel MYC-binding sites, validating an additional transcriptional activation role of MYC in cancer metabolism. Targeting mevalonate activity attenuated RAS-ERK-dependent BTIC growth and self-renewal. In turn, mevalonate created a positive feed-forward loop to activate MYC signaling via induction of miR-33b. Collectively, our results argue that MYC mediates its oncogenic effects in part by altering mevalonate metabolism in glioma cells, suggesting a therapeutic strategy in this setting. Cancer Res; 77(18); 4947-60. ©2017 AACR.


Conflict of interest statement

Conflict of interest statement: The authors declare no potential conflicts of interest.

Figures
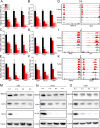
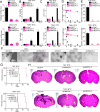
Figure 1
Figure 1. Brain tumor initiating cells (BTICs) upregulate the mevalonate synthesis pathway
A–F, qRT-PCR quantification of mRNA levels of mevalonate enzymes (HMGCR (A), PMVK (B), MVK (C), MVD (D), IDI1 (E) and FDPS (F)) in BTICs and differentiated glioma cells (DGCs). BTICs derived from three glioblastoma patient-derived xenografts (T3691, T387, T4121) were treated with serum to induce differentiation over a time course (2, 4, and 6 days). Data are presented as mean ± SEM from three independent experiments. *, p < 0.05; **, p < 0.01. G–L, Enrichment plots for active chromatin at the gene loci for HMGCR (G), PMVK (H), MVK (I), MVD (J), IDI1 (K) and FDPS (L). Active chromatin was profiled by histone 3 lysine 27 acetylation (H3K27ac) chromatin immunoprecipitation followed by deep sequencing (ChIP-seq) for five primary glioblastoma tumors, one normal brain tissue, and three matched pairs of BTICs and DGCs from patient-derived glioblastoma specimens. H3K27ac ChIP-seq data were downloaded from NCBI Gene Expression Omnibus (GEO) GSE54047. M–O, BTICs upregulate protein levels of mevalonate synthesis enzymes relative to DGCs. Protein levels for mevalonate enzymes (HMGCR and FDPS) and a BTIC marker (OLIG2) were assessed by immunoblotting in three matched pairs of BTICs and DGCs derived from three glioblastoma patient-derived xenografts (T3691, T387, T4121). TUBULIN was used as a loading control.
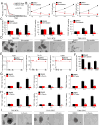
Figure 2
Figure 2. HMGCR regulates BTIC growth and self-renewal
A, Real time PCR quantification of HMGCR mRNA levels after transducing two BTIC models, T3691 and T387, with a control, non-targeting shRNA sequence (shCONT) or one of two independent shRNAs (designated as shHMGCR-1 and shHMGCR-2). Data are presented as mean ± SEM from three independent experiments. **, p < 0.01. B, Two independent shRNAs targeting HMGCR decreased the growth of T387 (top) and T3691 (bottom) BTICs in comparison to shCONT, as measured by a CellTiter-Glo assay. Data are presented as mean ± SEM from six independent experiments. **, p < 0.01. C, Two independent shRNAs targeting HMGCR decreased the growth of T387 (top) and T3691 (bottom) BTICs in comparison to a non-targeting control shRNA (shCONT), as measured by direct cell number count. Data are presented as mean ± SEM from four independent experiments. **, p < 0.01. D, In vitro extreme limiting dilution assays (ELDA) demonstrate that knockdown of HMGCR in T387 (top) and T3691 (bottom) BTICs decreased the frequency of neurosphere formation. E, Knockdown of HMGCR in T387 (top) and T3691 (bottom) BTICs decreased the number of spheres formed in ELDAs (per 1,000 cells seeded). Data are presented as mean ± SEM from six independent experiments. **, p < 0.01. F, Representative images of neurospheres derived from T387 (left) and T3691 (right) BTICs expressing shCONT, shHMGCR-1, or shHMGCR-2. Scale bar, 400 µm. G, Kaplan-Meier survival curves of immunocompromised mice bearing intracranial T387 (top) or T3691 (bottom) BTICs expressing shCONT and two independent HMGCR shRNA. p < 0.0001. 5 mice were used in each group. H, Representative images of hematoxylin and eosin stained cross-sections of mouse brains harvested on day 18 after transplantation of T387 (top) or T3691 (bottom) BTICs expressing shCONT and two independent HMGCR shRNA. Scale bar, 2 mm.
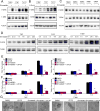
Figure 3
Figure 3. Mevalonate synthesis inhibition impairs BTIC growth and self-renewal
A, Interrogation of the TCGA glioblastoma dataset demonstrates a prognostic significance for HMGCR in the mesenchymal glioblastoma subtype. Patients were stratified by median HMGCR mRNA expression levels. B, Treatment with simvastatin (2 µM for 1, 3, and 5 days), a mevalonate synthesis inhibitor, and decreased growth of T387, T4121 and T3691 BTICs compared to vehicle control (DMSO), as measured by cell counts. Data are presented as mean ± SEM from four independent experiments. **, p < 0.01. C, Treatment with simvastatin (2 µM for 1, 3, and 5 days), a mevalonate synthesis inhibitor, and decreased growth of T387, T4121 and T3691 BTICs compared to vehicle control (DMSO), as measured by CellTiter Assay. Data are presented as mean ± SEM from six independent experiments. **, p < 0.01. D, Representative images of neurospheres derived from T387, T4121 and T3691 BTICs following treatment with simvastatin (2 µM, 5 days). Scale bar, 400 µm. E, In vitro extreme limiting dilution assays (ELDA) demonstrated that simvastatin (2 µM, 5 days) decreased the frequency of neurosphere formation in T387, T4121 and T3691 BTICs. F, Treatment with simvastatin (2 µM, 5 days) decreased clonal growth of T387, T4121 and T3691 BTICs compared to vehicle control (DMSO), as measured by neurosphere formation (measured per 1,000 cells seeded). Data are presented as mean ± SEM from six independent experiments. **, p < 0.01. G, Treatment with a distinct mevalonate pathway inhibitor, 6-fluoromevalonate (6-Fluoro, 10 µM for 1, 3, and 5 days), decreased the growth of T387, T4121 and T3691 BTICs in comparison to DMSO, as measured by direct cell number count. Data are presented as mean ± SEM from six independent experiments. **, p < 0.01. H, Treatment with a distinct mevalonate pathway inhibitor, 6-fluoromevalonate (6-Fluoro, 10 µM for 1, 3, and 5 days), decreased the growth of T387, T4121 and T3691 BTICs in comparison to DMSO, as measured by cell-titer assay. Data are presented as mean ± SEM from six independent experiments. **, p < 0.01. I, Representative images of neurospheres derived from T387, T4121 and T3691 BTICs following treatment with 6-fluoromevalonate (10 µM for 5 days). Scale bar, 400 µm.
Figure 4
Figure 4. Simvastatin inhibits BTIC growth and prolonged survival of mice bearing intracranial tumors
A and B, Kaplan-Meier survival curves of immunocompromised mice bearing intracranial T387 (A) or T3691 (B) BTICs treated with simvastatin. Five mice were used in each group. C and D, Representative images of hematoxylin and eosin stained cross-sections of mouse brains harvested day 35 after transplantation of T387 (C) and T3691 (D) BTICs treated with simvastatin. Scale bar, 2 mm. E and F, BTICs upregulate RAS activity after simvastatin treatment. RAS activity was assessed by Ras Activation Assay Kit in BTICs derived from patient-derived xenografts (T3691 and T387).
Figure 5
Figure 5. Simvastatin selectively inhibits BTIC growth through ERK pathway activation
A and B, BTICs (T3691, T387, and T4121) were treated with mevalonate pathway inhibitors, simvastatin (A, 2 µM for 48 hours) or 6-fluoromevalonate (B, 10 µM for 48 hours), at 2 µM for 48 hours. Whole cell lysates were resolved by SDS-PAGE, and levels of phospho-ERK and total ERK were assessed by immunoblot. Tubulin was used as a loading control. C, Five normal neural cell cultures (NM32, NM53, NM55, NM97, and ENSA) were treated with simvastatin (2 µM) for 48 hours. Whole cell lysates were resolved by SDS-PAGE, and levels of phospho-ERK and total ERK were assessed by immunoblot. Tubulin was used as a loading control. D, BTICs (T3691, T387, and T4121) were treated with simvastatin (2 µM) over a 48-hour time course. Whole cell lysates were resolved by SDS-PAGE, and levels of phospho-ERK and total ERK were assessed by immunoblot. E, MAPK-ERK pathway inhibitor, U0126, treatment partially rescued the cell growth defect of BTICs (T387 and T3691) treated with simvastatin, as measured by cell-titer assay. Data are presented as mean ± SEM from six independent experiments. **, p < 0.01. F, MAPK-ERK pathway inhibitor, U0126, treatment partially rescued the cell growth defect of BTICs (T387 and T3691) treated with simvastatin, as measured by direct cell number count. Data are presented as mean ± SEM from four independent experiments. **, p < 0.01. G, Representative images of neurospheres derived from T387 (left) and T3691 (right) BTICs treated with simvastatin alone, U0126 alone, and simvastatin combined with U0126. Scale bar, 400 µm.
Figure 6
Figure 6. MHYC regulates de novo mevalonate synthesis pathway enzymes in BTICs
A – G, mRNA levels of MYC (A) and mevalonate enzymes – HMGCR (B), PMVK (C), MVK (D), MVD (E), IDI1 (F), and FDPS (G) -- were assayed by qRT-PCR in T387 and T3691 BTICs upon MYC knockdown using two independent shRNAs. Data are presented as mean ± SEM from three independent experiments. **, p < 0.01. H, Knockdown of MYC in BTICs (T387 and T3691) using two independent shRNAs decreased protein levels of HMGCR and FDPS assessed by immunoblot in T387 and T3691 BTICs expressing shCONT, shMyc-1, or shMyc-2. TUBULIN was used as a loading control. I – N, MYC overexpression (I) upregulates mRNA levels of enzymes involved in the mevalonate synthesis pathway – HMGCR (J), PMVK (K), MVK (L), MVD (M), IDI1 (N) and FDPS (O) -- in differentiated glioma cells (T387 and T3691) transduced with either an empty vector (Vector) or a MYC overexpression vector (MYC), as measured by quantitative RT-PCR. Data are presented as mean ± SEM from three independent experiments. *, p < 0.05; **, p < 0.01. P, MYC overexpression upregulates protein levels of enzymes involved in the mevalonate synthesis pathway – HMGCR and FDPS -- in differentiated glioma cells (T387 and T3691) expressing an empty vector (Vector) or a MYC overexpression vector (MYC), as measured by immunoblot. TUBULIN was used as a loading control. Q and R, MYC binds directly to promoter regions of enzymes in Mevalonate synthesis pathway. Cross-linked chromatin was prepared from T387 (Q) and T3691 (R) BTICs, and then immunoprecipitated using an anti-MYC antibody or rabbit IgG control followed by real-time PCR using primers specific to promoter regions of HMGCR, PMVK, MVK, MVD, IDI1 and FDPS. Data are presented as mean ± SEM from three independent experiments. **, p < 0.01.
Figure 7
Figure 7. The mevalonate pathway regulates MYC expression through mir-33b
A, MYC activation significantly correlates with a transcriptional signature of mevalonate synthesis in TCGA glioblastoma samples. Single sample GSEA scores were calculated for TCGA RNA-seq data using a MYC activation signature derived from the Broad Institute Molecular Signatures Database and from a six-gene signature of mevalonate pathway genes. Shading indicates 95% confidence interval. B, MYC mRNA levels were measured in BTICs (T3691, T387, and T4121) by qRT-PCR upon treatment with vehicle control (DMSO) or simvastatin (2 µM) for 48 hours. Data are presented as mean ± SEM from three independent experiments. **, p < 0.01. C, BTICs (T3691, T387, and T4121) were treated with simvastatin (2 µM) for 48 hours. Whole cell lysates were resolved by SDS-PAGE, and MYC protein levels were assessed by immunoblot. Tubulin was used as a loading control. D, MYC mRNA levels were measured in BTICs (T3691, T387, and T4121) by qRT-PCR after treatment with vehicle control (DMSO) or 6-fluoromevalonate (2 µM) for 48 hours. Data are presented as mean ± SEM from three independent experiments. **, p < 0.01. E, MYC protein levels were measured in BTICs (T3691, T387, and T4121) by immunoblot after treatment with vehicle control (DMSO) or 6-fluoromevalonate (2 µM) for 48 hours. Whole cell lysates were resolved by SDS-PAGE, and levels of MYC was assessed by immunoblot. TUBULIN was used as a loading control. F, MYC mRNA levels were measured in BTICs (T3691 and T387) by qRT-PCR upon treatment with vehicle control (DMSO), simvastatin (2 µM), U0126, or simvastatin and U0126 for 48 hours. Data are presented as mean ± SEM from three independent experiments. **, p < 0.01. G, MYC protein levels were quantified in two BTIC models (T3691 and T387) treated with simvastatin, U0126, or U0126 plus simvastatin for 48 hours. H, miR-33b levels were measured by qRT-PCR in two BTIC lines (T3691 and T387) treated with simvastatin, U0126, or U0126 plus simvastatin for 48 hours. Data are presented as mean ± SEM from three independent experiments. **, p < 0.01. I, MYC mRNA levels were quantified by qRT-PCR in two BTIC lines (T3691 and T387) transduced with a miR-33b mimic for 48 hours. Data are presented as mean ± SEM from three independent experiments. **, p < 0.01. J, MYC protein levels were assayed by immunoblot in two BTICs (T3691 and T387) transduced with either an empty vector or a miR-33b expression vector for 48 hours. TUBULIN was used as a loading control.

References

    1. Ostrom QT, Gittleman H, de Blank PM, Finlay JL, Gurney JG, McKean-Cowdin R, et al. American Brain Tumor Association Adolescent and Young Adult Primary Brain and Central Nervous System Tumors Diagnosed in the United States in 2008–2012. Neuro Oncol. 2016;18(Suppl 1):i1–i50. - PMC - PubMed
    1. Stupp R, Hegi ME, Mason WP, van den Bent MJ, Taphoorn MJ, Janzer RC, et al. Effects of radiotherapy with concomitant and adjuvant temozolomide versus radiotherapy alone on survival in glioblastoma in a randomised phase III study: 5-year analysis of the EORTC-NCIC trial. Lancet Oncol. 2009;10:459–66. - PubMed
    1. Gilbert MR, Dignam JJ, Armstrong TS, Wefel JS, Blumenthal DT, Vogelbaum MA, et al. A randomized trial of bevacizumab for newly diagnosed glioblastoma. N Engl J Med. 2014;370:699–708. - PMC - PubMed
    1. Bao S, Wu Q, Sathornsumetee S, Hao Y, Li Z, Hjelmeland AB, et al. Stem cell-like glioma cells promote tumor angiogenesis through vascular endothelial growth factor. Cancer Res. 2006;66:7843–8. - PubMed
    1. Bao S, Wu Q, McLendon RE, Hao Y, Shi Q, Hjelmeland AB, et al. Glioma stem cells promote radioresistance by preferential activation of the DNA damage response. Nature. 2006;444:756–60. - PubMed

MeSH terms