

Cohesins and condensins orchestrate the 4D dynamics of yeast chromosomes during the cell cycle
- PMID: 28729434
- PMCID: PMC5599795
- DOI: 10.15252/embj.201797342
Cohesins and condensins orchestrate the 4D dynamics of yeast chromosomes during the cell cycle
Abstract
Duplication and segregation of chromosomes involves dynamic reorganization of their internal structure by conserved architectural proteins, including the structural maintenance of chromosomes (SMC) complexes cohesin and condensin. Despite active investigation of the roles of these factors, a genome-wide view of dynamic chromosome architecture at both small and large scale during cell division is still missing. Here, we report the first comprehensive 4D analysis of the higher-order organization of the Saccharomyces cerevisiae genome throughout the cell cycle and investigate the roles of SMC complexes in controlling structural transitions. During replication, cohesion establishment promotes numerous long-range intra-chromosomal contacts and correlates with the individualization of chromosomes, which culminates at metaphase. In anaphase, mitotic chromosomes are abruptly reorganized depending on mechanical forces exerted by the mitotic spindle. Formation of a condensin-dependent loop bridging the centromere cluster with the rDNA loci suggests that condensin-mediated forces may also directly facilitate segregation. This work therefore comprehensively recapitulates cell cycle-dependent chromosome dynamics in a unicellular eukaryote, but also unveils new features of chromosome structural reorganization during highly conserved stages of cell division.
Keywords: SMC; Hi‐C; chromosome segregation; loop extrusion; replication profile.
© 2017 The Authors. Published under the terms of the CC BY 4.0 license.
Figures

- A
Overview of the different synchronization time points with corresponding FACS profiles and representative images of DAPI‐stained cells.
- B
3D average representation of the Hi‐C contact map of a yeast G1 population. The color code reflects chromosomal arm lengths, and centromeres, telomeres, and rDNA are highlighted.
- C, D
Comparison of contact maps. The 16 yeast chromosomes are displayed atop the maps. Black arrowheads: inter‐telomere contacts. Yellow arrowheads: inter‐centromeric contacts. Left panels: Hi‐C maps obtained from two G1 cell populations synchronized independently (C) and from G1 and G0 populations (D). Brown to yellow color scales reflect high to low contact frequencies, respectively (log10). Right panels: log‐ratio between each pair of maps. Insets display magnifications of chr4. Blue to red color scales reflect the enrichment in contacts in one population with respect to the other (log2).
- E
Pairwise Euclidian distances between contact maps of populations of G0, G1 either synchronized with elutriation or blocked using a cdc6 mutant, metaphase (cdc20 mutant), and anaphase (cdc15 mutant) cells. Color code: contact map similarity.
- F
Principal component analysis (PCA) of the distance matrix in (E).

- A, B
Contact maps generated from synchronized cell populations described in this study, with each vector (or bin) corresponding to 5 kb. x‐ and y‐axis represent the 16 chromosomes of the yeast genome, displayed atop the maps. Brown to yellow color scales reflect high to low contact frequencies, respectively (log10). Magnification panels in (B) show variations of the contact frequencies between synchronized populations. Yellow and pink arrowheads point at centromeres and rDNA positions, respectively.
- C
3D average representations of the Hi‐C contact maps of synchronized cell populations of panel (A). The color code represents the chromosomal arm length, and centromeres, telomeres, and rDNA flanking regions are highlighted.
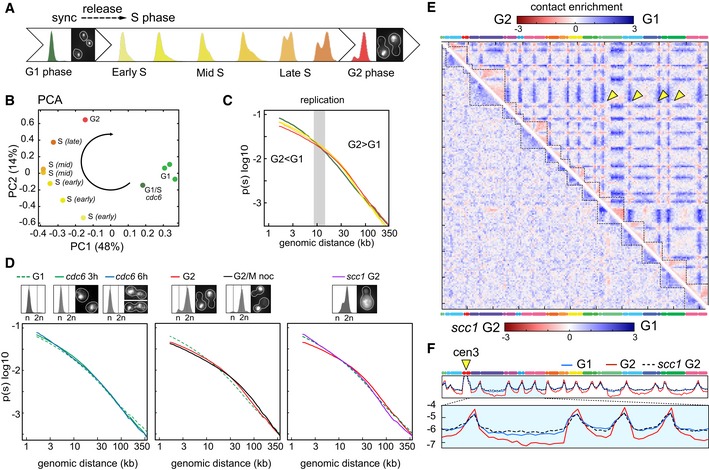
FACS profiles and representative DAPI‐stained cells of G1 synchronized cells released in S phase.
PCA of the distance matrix between the contact maps of the population displayed in (A).
P(s), that is, average intra‐chromosomal contact frequency P between two loci with respect to their genomic distance s along the chromosome (log–log scale) during replication (color code identical to FACS profiles and PCA).
Left panel: P(s) of replication‐defective cells (cdc6 thermosensitive mutant). G1 elutriated cells were released for 3 h and 6 h in non‐permissive conditions. The corresponding FACS profiles show no S‐phase progression. Middle panel: P(s) of cells that completed replication. G1 elutriated cells were released in S phase in the absence or presence of nocodazole (G2/M noc). Right panel: P(s) of cohesin‐depleted (scc1 G2) and nocodazole‐arrested cells.
Log‐ratio of contact maps between G2 and G1 cells (top right) and scc1 G2 and G1 cells (bottom left). Blue to red color scales reflect the enrichment in contacts in one population with respect to the other (log2). Yellow arrowheads: inter‐centromere contacts.
Normalized contact frequencies between chr3 centromere (cen3; yellow arrowhead) and the rest of the genome for G1, G2, and scc1 G2.

- A, B
Contact maps recovered from cell populations undergoing replication after G1 release. For each contact map, the FACS profile is displayed. x‐ and y‐axis represent the 16 chromosomes of the yeast genome. The same color code as in Fig EV1. Magnification panels in (B) highlight changes of the contact frequencies during S‐phase progression. Yellow and pink arrowheads point at centromeres and rDNA positions, respectively.
- C
3D average representations of the Hi‐C contact maps of synchronized cell populations of panel (A). The color code represents the chromosomal arm length, and centromeres, telomeres, and rDNA flanking regions are highlighted.

Comparison of replication profiles of the synchronized populations used for the analysis displayed in Fig 2G. The read coverage of raw Hi‐C libraries reflects the replication progression throughout S phase, plotted along the 16 chromosomes of the yeast genome (top axis; blue curve). The replication timing obtained in this study is highly similar to the one from McCune et al (2008) (yellow curve).
Superposition of three 3D representations of chromosomes in early replication (I, II, III). The color scale indicates the replication timing. Centromeres and telomeres are highlighted. Different views of the structure are presented.
Pattern of the replication profile for each of the chromosomal arms. The color code reflects the timing of replication.
- A
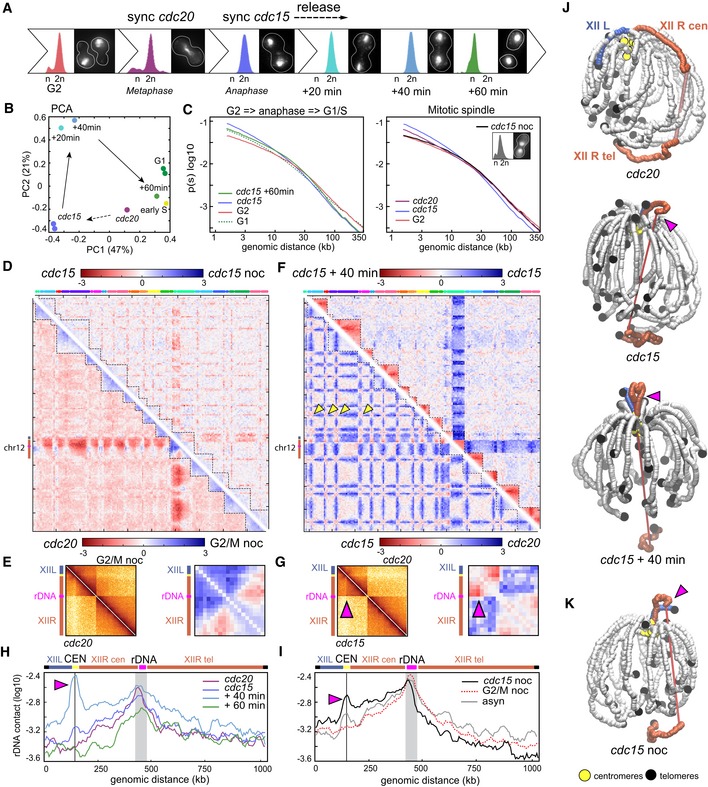
FACS profiles and representative DAPI‐stained cells of synchronized and/or released populations, from G2 until re‐entry in G1/S.
- B
PCA of the distance matrix between the contact maps of the populations described in (A).
- C
Left panel: P(s) of cells in G1, G2, and anaphase (cdc15) and released from a cdc15 arrest (cdc15+60 min). Right panel: P(s) of G2, cdc20‐, and cdc15‐arrested cells in the absence or presence of nocodazole (cdc15 noc).
- D
Log‐ratio of contact maps. Bottom left: ratio between cells arrested in metaphase (cdc20) or at the G2/M transition with nocodazole (G2/M noc). Top right: ratio of cells blocked in anaphase and treated or not with nocodazole (cdc15 noc and cdc15, respectively). Blue to red color scales reflect the enrichment in contacts in one population with respect to the other (log2).
- E
Left: chr12‐normalized contact maps of cells arrested at the G2/M transition and cdc20‐arrested cells. Right: magnification of the log‐ratio map from (D, bottom left).
- F
Log‐ratio of contact maps. Bottom left: log‐ratio between cdc20‐ and cdc15‐arrested cells. Top right: log‐ratio of cdc15‐arrested and cdc15‐released (40 min) cells. Blue to red color scales reflect the enrichment in contacts in one population with respect to the other (log2). Yellow arrowheads: inter‐centromere contacts.
- G
Left: chr12‐normalized contact maps in cdc20‐ and cdc15‐arrested cells. Right: magnification of the log‐ratio map from (F, bottom left). Pink arrowheads point at the right arm anaphase loop.
- H, I
Distributions of intra‐chromosomal contacts made by a 20‐kb cen‐proximal rDNA flanking region (highlighted in gray) with the rest of chr12 in cdc20‐, cdc15‐, cdc15‐released (+40 min, +60 min), nocodazole‐treated (G2/M noc, cdc15 noc), and asynchronous (asyn) cells. Schematic representations of chr12 are displayed atop the graphs. Gray lines indicate centromere position. Pink arrowheads point at the right arm anaphase loop.
- J
3D representations of the contact maps from cdc20‐ and cdc15‐arrested and cdc20‐ and cdc15‐released (+40 min) cells. The right (XIIR) and left (XIIL) arms of chr12 are highlighted in red and blue, respectively. Pink arrowheads point at the right arm anaphase loop. Centromeres and telomeres are highlighted.
- K
3D representation of the contact map from cdc15 noc cells. Pink arrowhead points at the right arm anaphase loop.

- A, B
Contact maps of cell populations synchronized in metaphase (cdc20) and anaphase (cdc15) and released into mitosis from cdc15 block (+20 min, +40 min, and +60 min). The corresponding FACS profiles and representative DAPI‐stained cells are displayed on the left on the maps. x‐ and y‐axis represent the 16 chromosomes of the yeast genome. The same color code as in Fig EV1. Magnification panels in (B) display variations of the contact frequencies during mitotic progression. Yellow and pink arrowheads point at centromeres and rDNA positions, respectively.
- C
3D average representations of the Hi‐C contact maps of panel (A). The color code represents the chromosomal arm length, and centromeres, telomeres, and rDNA flanking regions are highlighted.

- A, B
Contact maps of G1 synchronized cell populations released either in the presence of nocodazole (G2/M noc) or at cdc15 non‐permissive temperature followed by a nocodazole treatment (cdc15 noc). The corresponding FACS profiles and representative DAPI‐stained cells are displayed on the left on the maps. x‐ and y‐axis represent the 16 chromosomes of the yeast genome. The same color code as in Fig EV1. Magnification panels in (B) display variations of the contact frequencies. Yellow and pink arrowheads point at centromeres and rDNA positions, respectively.
- C
3D average representations of the Hi‐C contact maps of panel (A). The color code represents the chromosomal arm length, and centromeres, telomeres, and rDNA flanking regions are highlighted.
- A
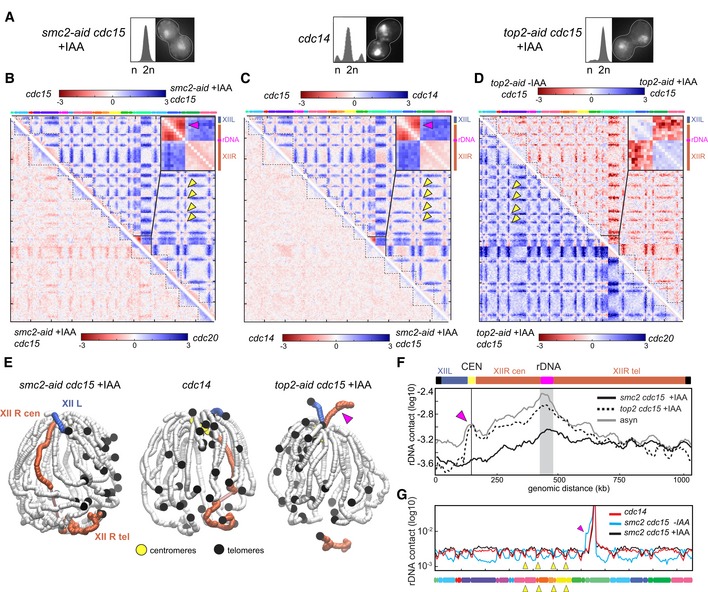
FACS profiles and representative DAPI‐stained cells of cells blocked in anaphase, in the absence of condensin (smc2‐aid cdc15 +IAA and cdc14) or topoisomerase 2 (top2‐aid cdc15 +IAA).
- B–D
Log‐ratio of contact maps. Yellow arrowheads: inter‐centromere contacts. The pink arrowheads point at the right arm anaphase loop on chr12. Insets display magnification of the chr12 ratio map. (B) Ratio map between (bottom left) cdc20 and smc2‐aid cdc15 cells and between (top right) cells blocked in anaphase with our without condensin depletion (cdc15 and smc2‐aid cdc15 +IAA). (C) Ratio map between (bottom left) cdc14 and smc2‐aid cdc15 +IAA cells and between (top right) cdc14 and cdc15 cells. (D) Ratio map between (bottom left) top2‐aid cdc15 +IAA and cdc20 cells and (top right) top2‐aid cdc15 ‐IAA and top2‐aid cdc15 +IAA cells.
- E
3D representations of the contact maps from smc2‐aid cdc15 +IAA‐, cdc14‐, and top2‐aid cdc15 +IAA‐arrested cells. The right (XIIR) and left (XIIL) arms of chr12 are highlighted in red and blue, respectively. Pink arrowhead points at the right arm anaphase loop.
- F
Distribution of intra‐chromosomal contacts of a cen‐proximal rDNA flanking region (highlighted in gray) with the rest of chr12 in smc2 cdc15, top2 cdc15, and asynchronous (asyn) cells. Pink arrowhead points at the right arm anaphase loop.
- G
Normalized contact frequencies between the left rDNA flanking region (50 kb) and the rest of the genome in cdc15 smc2‐aid (‐IAA) and cdc15 smc2‐aid (+IAA) cells. Yellow arrowheads point at a subset of centromeric positions. Pink arrowhead points at the right arm anaphase loop.

- A, B
Contact maps of cell populations arrested in anaphase, either defective with condensation (cdc14 or smc2‐aid cdc15 +IAA) or depleted of topoisomerase 2 (top2‐aid cdc15 +IAA). The corresponding FACS profiles and representative DAPI‐stained cells are displayed on the left on the maps. x‐ and y‐axis represent the 16 chromosomes of the yeast genome. The same color code as in Fig EV1. Magnification panels in (B) display variations of the contact frequencies. Yellow and pink arrowheads point at centromeres and rDNA positions, respectively.
- C
3D average representations of the Hi‐C contact maps of panel (A). The color code represents the chromosomal arm length, and centromeres, telomeres, and rDNA flanking regions are highlighted.

Dynamics of centromere contacts (top panel), Short‐/long‐range contact ratio (middle panel) and intra‐/inter‐chromosomal contact ratio (bottom panel) for each of the 20 time points (blue dots; see bottom x‐axis) during the cell cycle. The three folding states (I, II, and III; Fig EV4) identified in the analysis are indicated under the panels, as well as interpretation with respect to individualization status.
Illustration of the three chromatin folding states characteristic of each of the cell cycle phases. Establishment of sister‐chromatid (SC) cohesion during S phase increases intra‐SC long‐range contacts and leads to the individualization of the replicated chromosomes. Then during M phase, the two sisters are segregated and each chromatid (C) individualized thanks to the action combination of cohesin cleavage, condensin loading and spindle elongation. The chromosomes display a stretched internal structure, which relaxed upon destabilization of the spindle with nocodazole.
Model of loop extrusion generating the condensin‐dependent loop formation between the centromere and the rDNA cluster, two regions enriched in condensin deposition. A loop formed in between the centromere and the rDNA cluster may extend until it reaches these two discrete positions, and stall because of mechanic impediment blocking further extrusion.

P(s) for four different time points along the cycle. Each curve represents the average between three replicates with error bars corresponding to the standard deviation.
To assess the statistical significance of the differences between short (resp. long)‐range contacts between these three time points, we computed a P‐value for each pairwise comparison between two time points using Wilcoxon signed‐rank test. The two distributions to compared were built by aggregating all the data points below (resp. above) 10 kb for the three replicates for each time point.
Comment in
-
Chromosome structure dynamics during the cell cycle: a structure to fit every phase.EMBO J. 2017 Sep 15;36(18):2661-2663. doi: 10.15252/embj.201798014. Epub 2017 Sep 4. EMBO J. 2017. PMID: 28871059 Free PMC article.
References
-
- Aragon L, Martinez‐Perez E, Merkenschlager M (2013) Condensin, cohesin and the control of chromatin states. Curr Opin Genet Dev 23: 204–211 - PubMed
-
- Baxter J, Sen N, Martínez VL, Carandini MEMD, Schvartzman JB, Diffley JFX, Aragón L (2011) Positive supercoiling of mitotic DNA drives decatenation by topoisomerase II in eukaryotes. Science 331: 1328–1332 - PubMed
-
- Blat Y, Kleckner N (1999) Cohesins bind to preferential sites along yeast chromosome III, with differential regulation along arms versus the centric region. Cell 98: 249–259 - PubMed
MeSH terms
Substances
Grants and funding
LinkOut - more resources
Full Text Sources
Other Literature Sources
Molecular Biology Databases
