. 2017 Jul 20;7(1):6035.
doi: 10.1038/s41598-017-06121-2.

PLD1 promotes dendritic spine development by inhibiting ADAM10-mediated N-cadherin cleavage

Affiliations

PLD1 promotes dendritic spine development by inhibiting ADAM10-mediated N-cadherin cleavage

Li-Da Luo et al. Sci Rep. .

Abstract

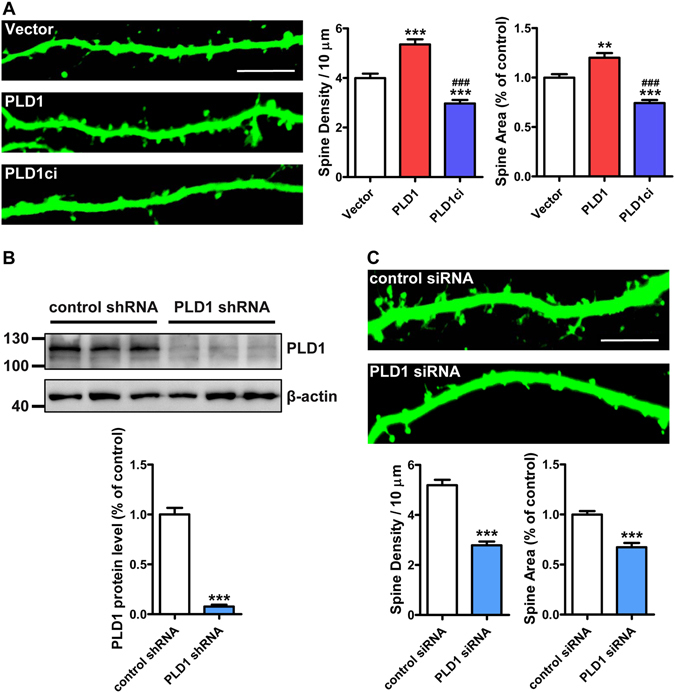
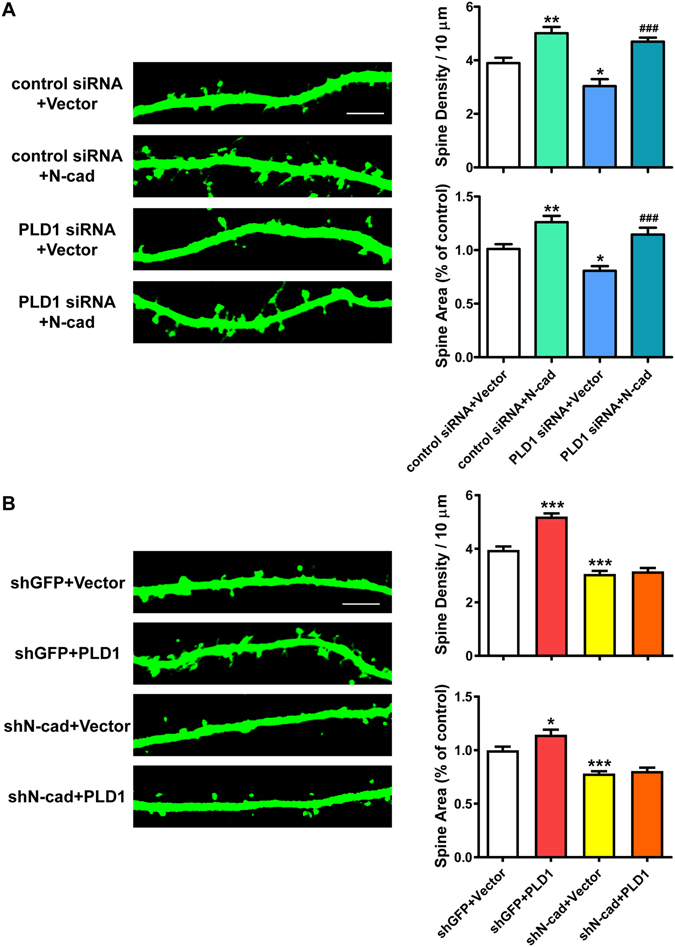
Synapses are the basic units of information transmission, processing and integration in the nervous system. Dysfunction of the synaptic development has been recognized as one of the main reasons for mental dementia and psychiatric diseases such as Alzheimer's disease and autism. However, the underlying mechanisms of the synapse formation are far from clear. Here we report that phospholipase D1 (PLD1) promotes the development of dendritic spines in hippocampal neurons. We found that overexpressing PLD1 increases both the density and the area of dendritic spines. On the contrary, loss of function of PLD1, including overexpression of the catalytically-inactive PLD1 (PLD1ci) or knocking down PLD1 by siRNAs, leads to reduction in the spine density and the spine area. Moreover, we found that PLD1 promotes the dendritic spine development via regulating the membrane level of N-cadherin. Further studies showed that the regulation of surface N-cadherin by PLD1 is related with the cleavage of N-cadherin by a member of the disintegrin and metalloprotease family-ADAM10. Taking together, our results indicate a positive role of PLD1 in synaptogenesis by inhibiting the ADAM10 mediated N-cadherin cleavage and provide new therapeutic clues for some neurological diseases.


Conflict of interest statement

The authors declare that they have no competing interests.

Figures

Figure 1
Figure 1
PLD1 promotes the dendritic spine development. (A) Representative images and quantification of the spine density and spine area in DIV15 hippocampal neurons co-transfected GFP with HA-tagged Vector, PLD1 or PLD1ci (n = 16, 12 and 16 cells, respectively in columns shown in the graphs) at DIV8. Scale bar, 10 μm. **p < 0.01, ***p < 0.001 compared with Vector, ###p < 0.001 compared with PLD1; one-way ANOVA with Bonferroni’s multiple-comparisons test. (B) Knockdown effect of endogenous PLD1 by lentivirus containing PLD1 shRNA in cortical neurons. n = 3, ***p < 0.001, unpaired t-test. (C) Representative images and quantification of the spine density and spine area in DIV15 hippocampal neurons co-transfected GFP with control siRNA or PLD1 siRNA (n = 16 and 15 cells, respectively) at DIV8. Scale bar, 10 μm. ***p < 0.001, unpaired t-test.
Figure 2
Figure 2
PLD1 regulates the membrane level of N-cadherin. (A,B) Surface biotinylation assay of membrane level of N-cadherin in cortical neurons treated with different concentration of 1/2-butanol. n = 5 (A) or 3 (B), **p < 0.01, paired t-test. 1/2-but, 1/2-butanol. (C,D) Surface biotinylation assay of membrane level of N-cadherin in cortical neurons treated with different concentration of PLD1 inhibitor VU 0155069 or vehicle control DMSO. n = 3, *p < 0.05, **p < 0.01, paired t-test. (E) Surface biotinylation assay of membrane level of N-cadherin in cortical neuron infected with lentivirus containing control shRNA or PLD1 shRNA. n = 3, **p < 0.01, paired t-test.
Figure 3
Figure 3
PLD1 acts upstream of N-cadherin in the dendritic spine development. (A) Representative images and quantification of spine density and area of DIV15 hippocampal neurons co-transfected with control siRNA + Vector (myc-Vector), control siRNA + N-cad (myc-N-cadherin), PLD1 siRNA + Vector or PLD1 siRNA + N-cad (n = 16, 14, 15 and 14 cells, respectively) plus GFP at DIV8. Scale bar, 5 μm. *p < 0.05, **p < 0.01 compared with control siRNA + Vector, ###p < 0.001 compared with PLD1 siRNA + Vector, one-way ANOVA with Bonferroni’s multiple-comparisons test. (B) Representative images and quantification of spine density and area of DIV15 hippocampal neurons transfected with shGFP + Vector (HA-Vector), shGFP + PLD1, shN-cad + Vector or shN-cad + PLD1 (n = 17, 14, 16 and 18 cells, respectively) at DIV8. Scale bar, 5 μm. *p < 0.05, ***p < 0.001 compared with shGFP + Vector, one-way ANOVA with Bonferroni’s multiple-comparisons test. shN-cad represents N-cadherin shRNA co-expressing GFP and shGFP represents control shRNA co-expressing GFP.
Figure 4
Figure 4
PLD1 inhibits the cytoplasmic cleavage of N-cadherin. (A,B) The effect of different concentration of 1-butanol treatment on the level of N-cadherin C-terminal fragment CTF1 produced by the cytoplasmic cleavage of N-cadherin in cortical neurons. n = 3, *p < 0.05, ***p < 0.001, unpaired t-test. N-cad FL, full-length N-cadherin. (C,D) The effect of different concentration of VU 0155069 treatment on the production of N-cadherin CTF1 in cortical neurons. n = 3, *p < 0.05, ***p < 0.001, unpaired t-test. (E) The effect of lentivirus containing PLD1 shRNA infection on the production of N-cadherin CTF1 in cortical neurons. n = 3, *p < 0.05, unpaired t-test.
Figure 5
Figure 5
PLD1 inhibits ADAM10-mediated N-cadherin cleavage. (A) ADAM10 inhibitor GI254023X reversed the effect on the level of N-cadherin CTF1 caused by lentivirus containing PLD1 shRNA in cortical neurons. Three independent experiments were conducted. (B) Co-IP of HA-tagged PLD1 with ADAM10 in N2a cells transfected with HA-tagged PLD1. HA-Vector represents the negative control. The band of immunoprecipitated ADAM10 by PLD1 was labeled with an asterisk. IP, immunoprecipitation. Three independent experiments were conducted.
Figure 6
Figure 6
Working hypothesis. PLD1 prevents ADAM10 from cleaving membrane N-cadherin dependent on the catalytic activity of PLD1, thus maintaining the stability of membrane N-cadherin at dendritic spines. Inhibition of PLD1 activity or knocking down PLD1 loses the restriction to ADAM10 and promotes the cytoplasmic cleavage of N-cadherin.

References

    1. Hering H, Sheng M. Dendritic spines: structure, dynamics and regulation. Nat Rev Neurosci. 2001;2:880–888. doi: 10.1038/35104061. - DOI - PubMed
    1. Sheng M, Kim MJ. Postsynaptic signaling and plasticity mechanisms. Science. 2002;298:776–780. doi: 10.1126/science.1075333. - DOI - PubMed
    1. Glantz LA, Lewis DA. Decreased dendritic spine density on prefrontal cortical pyramidal neurons in schizophrenia. Arch Gen Psychiatry. 2000;57:65–73. doi: 10.1001/archpsyc.57.1.65. - DOI - PubMed
    1. Hutsler JJ, Zhang H. Increased dendritic spine densities on cortical projection neurons in autism spectrum disorders. Brain Res. 2010;1309:83–94. doi: 10.1016/j.brainres.2009.09.120. - DOI - PubMed
    1. Penzes P, Cahill ME, Jones KA, VanLeeuwen JE, Woolfrey KM. Dendritic spine pathology in neuropsychiatric disorders. Nat Neurosci. 2011;14:285–293. doi: 10.1038/nn.2741. - DOI - PMC - PubMed

Publication types