. 2017 Jul 20;7(1):6030.
doi: 10.1038/s41598-017-05952-3.

A new approach for ratiometric in vivo calcium imaging of microglia

Affiliations

A new approach for ratiometric in vivo calcium imaging of microglia

Bianca Brawek et al. Sci Rep. .

Abstract

Microglia, resident immune cells of the brain, react to the presence of pathogens/danger signals with a large repertoire of functional responses including morphological changes, proliferation, chemotaxis, production/release of cytokines, and phagocytosis. In vitro studies suggest that many of these effector functions are Ca2+-dependent, but our knowledge about in vivo Ca2+ signalling in microglia is rudimentary. This is mostly due to technical reasons, as microglia largely resisted all attempts of in vivo labelling with Ca2+ indicators. Here, we introduce a novel approach, utilizing a microglia-specific microRNA-9-regulated viral vector, enabling the expression of a genetically-encoded ratiometric Ca2+ sensor Twitch-2B in microglia. The Twitch-2B-assisted in vivo imaging enables recording of spontaneous and evoked microglial Ca2+ signals and allows for the first time to monitor the steady state intracellular Ca2+ levels in microglia. Intact in vivo microglia show very homogenous and low steady state intracellular Ca2+ levels. However, the levels increase significantly after acute slice preparation and cell culturing along with an increase in the expression of activation markers CD68 and IL-1β. These data identify the steady state intracellular Ca2+ level as a versatile microglial activation marker, which is highly sensitive to the cell's environment.


Conflict of interest statement

The authors declare that they have no competing interests.

Figures

Figure 1
Figure 1
Expression of target genes (GFP or Twitch-2B) in LV.miR-9.T vector-transduced brain tissue. (a) Scheme of the LV.PGK.GFP.miR-9.T construct. (b) Maximum intensity projection (MIP) images (5–15 µm, step 1 µm) illustrating the identity of LV.PGK.GFP.miR-9.T-transduced cells (left) through immunofluorescent staining with an antibody against the microglial marker Iba1 (middle). The colour merged image is shown on the right. (c) Two-photon MIP in vivo image (18–27 µm, step 2 µm) of the transduced cells showing typical microglial morphology. Inset is a MIP image (3–21 µm, step 1 µm) showing a zoom-in of a rectangular square in the middle of the image. (d) Scheme of the LV.PGK.Twitch-2B.miR-9.T construct. (e,f) MIP images ((e) 0–19 µm, (f) 0–20 µm, step 1 µm) showing either native fluorescence of the cells transduced with LV.PGK.Twitch-2B.miR-9.T construct (left) or fluorescence of the same area labelled with an anti-GFP antibody recognizing Twitch-2B (right).
Figure 2
Figure 2
Optimization of the LV.Twitch-2B.miR-9.T vector. (a) Illustration of the experimental approach to test the efficacy of LV.Twitch-2B.miR-9.T vectors with different promoters. Lentiviral vectors were first compared in HEK293 cells in vitro and then tested in the brain in vivo. (bd) Epifluorescence single-plane images of HEK293 cells transduced with different viral vectors shown in (a), taken with the same excitation light intensity and exposure time. Insets show the contrast-enhanced display of the same image. Numbers in the lower left corner show the range of display for each image. (e,f) Single-plane images of the fixed striatal (e) or cortical (f) tissue transduced in vivo with LV.CMV.Twitch-2B.miR-9.T viral vector. Note that Twitch-2B-expressing cells (left) are positive for CD11b (e, middle) and Iba1 (f, middle) and therefore are microglial cells. The colour merged images are shown on the right.
Figure 3
Figure 3
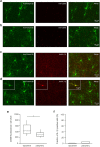
Post hoc analyses of activation markers expressed in Twitch-2B labelled microglia. (a,b) MIP images of fixed cortical tissue, transduced in vivo with LV.CMV.Twitch-2B.miR-9.T viral vector, taken in the epicentre (a; 7–59 µm, step 1 µm) and at the periphery (b; 4–44 µm, step 1 µm) of the injection site. Left: Twitch-2B positive microglial cells labelled with an anti-GFP antibody. Middle: the same field of view labelled with anti-CD68 antibody. Merged images are shown on the right. (c,d) MIP images of fixed cortical tissue (as above) taken in the epicentre (c; 2–28 µm, step 1 µm) and at the periphery (d; 1–33 µm, step 1 µm) of the injection site. Left: Twitch-2B positive microglial cells labelled with an anti-GFP antibody. Middle: the same field of view labelled with anti-IL-1β antibody. Merged images are shown on the right. Inset in (d) shows a rare Twitch-2B and IL-1β positive cell at the periphery of the injection site. (e) Summary box plot illustrating distributions of background-subtracted CD68 fluorescence per microglial cell in the epicentre (n = 100 cells in 3 mice) and at the periphery (n = 86 cells in 3 mice) of the injection site. Note that CD68 fluorescence is significantly higher in microglia in the epicentre compared to periphery (p < 0.001, Mann-Whitney test). (f) Summary bar graph showing the fraction of IL-1β positive cells in the population of Twitch-2B positive microglia in the epicentre (n = 31 cells in 4 mice) and at the periphery (n = 54 cells in 5 mice) of the injection site.
Figure 4
Figure 4
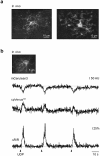
LV.CMV.Twitch-2B.miR-9.T vector enables ratiometric calcium imaging of microglia in vivo. (a) MIP images (left: 18–33 µm depth; right: 17–36 µm depth, step 1 µm) showing combined fluorescence of mCerulean3 and cpVenusCD of cortical microglia in vivo. (b) Representative traces, recorded from the region of interest delineated in the inset (dashed line), showing mCerulean3 (top) and cpVenusCD (middle) channels for three pressure applications of a P2Y receptor agonist UDP (1 mM in the application pipette, 200 ms). Inset: MIP image (117–153 µm depth, step 1 µm) of the recorded microglial cell. Bottom: trace showing the ΔR/R signal. Arrowheads indicate time points of UDP applications. Similar results were obtained in n = 5 cells (summarized in Fig. 5b).
Figure 5
Figure 5
Versatility of the LV.CMV.Twitch-2B.miR-9.T vector for in vivo Ca2+ imaging of microglia. (a) Representative microglial Ca2+-transient evoked by pressure-application of a P2X receptor agonist Bz-ATP (1 mM in the application pipette, 100 ms). (b) Summary box plot showing peak amplitudes evoked by pressure-applications of UDP (1 mM, n = 5 cells) and Bz-ATP (1 mM, n = 5 cells) in microglial cells in vivo. (c) Bar graph showing the fraction of microglia with and without spontaneous Ca2+-activity over a 10-min-long imaging period (n = 10 cells). (d) Representative microglial Ca2+-transient evoked by damaging a neuron in cell’s vicinity (cell-to-cell distance 18 µm). (e) Box plot showing distribution of peak amplitudes of microglial Ca2+ transients evoked by damaging cells located 15–38 µm apart from the recorded microglia (n = 7 cell damage-induced transients, each caused by damaging a separate cell, recorded from 4 cells in 4 mice). The cell damage-induced Ca2+ transients were observed in 4 out of 5 microglial cells tested. (f) MIP image (56–84 µm depth, step 1 µm), taken 60 min after a laser induced injury of the cortical parenchyma, showing a Twitch-2B positive microglia (green, combined fluorescence of mCerulean3 and cpVenusCD) responding to tissue damage. Note that tissue autofluorescence (yellow) is increased in the laser-damaged area (indicated by a broken white line). (g) Box plot illustrating a significant increase in basal cpVenusCD/mCerulean3 fluorescence ratio in microglia after laser-induced damage compared to control conditions (median: 1.43, IQR: 1.19–1.93, p < 0.05; Wilcoxon Signed-rank test; n = 6 cells in 3 mice). The laser induced injury increased cpVenusCD/mCerulean3 fluorescence ratios in all microglial cells tested.
Figure 6
Figure 6
Use of the LV.Twitch-2B.miR-9.T vector enables estimation of basal Ca2+ levels in microglia. (a) MIP image (6–15 µm depth, step 1 µm; mCerulean3 channel) showing Twitch-2B-positive ramified microglial cells in culture. (b) MIP images of the same preparation after fixation and labelling with an anti-Iba1 antibody. Left: native fluorescence of Twitch-2B (combined signal from mCerulean3 and cpVenusCD); middle: fluorescence of Alexa Fluor 594 bound to anti-Iba1 antibody; right: a colour merged image of the two channels. (c) Box plot showing cpVenusCD/mCerulean3 fluorescence ratios of cortical microglia and neurons under different experimental conditions. When compared to ramified microglia in acute in vivo preparations (n = 32 cells), microglia in primary cell culture (n = 50 cells) and acute brain slices (n = 25 cells) show elevated cpVenusCD/mCerulean3 ratios (p < 0.0001 for acute in vivo vs. brain slice and 0.007 for acute in vivo vs. cell culture, Kruskal-Wallis test followed by post hoc Dunn-Sidak test). The same is true for comparison with microglia in chronic in vivo preparations (n = 15 cells; p < 0.0001 for chronic in vivo vs. brain slice and 0.006 for chronic in vivo vs. cell culture, Kruskal-Wallis test with post hoc Dunn-Sidak correction). In acute preparations, microglia exhibit significantly higher Ca2+-levels than cortical layer 2/3 neurons labelled with a AAV.synapsin1.Twitch-2B vector (n = 147 cells; p < 0.0001, Mann-Whitney test). TTX (2 µM) has no effect on basal cpVenusCD/mCerulean3 ratios of cortical neurons (n = 202 cells; p = 0.343, Kruskal-Wallis test with post hoc Dunn-Sidak correction). Note that neurons in acute brain slices (n = 601 cells) have slightly but significantly higher Ca2+-levels compared to those in acute in vivo preparations (p < 0.0001, Kruskal-Wallis test with post hoc Dunn-Sidak correction).

References

    1. Hanisch UK, Kettenmann H. Microglia: active sensor and versatile effector cells in the normal and pathologic brain. Nat. Neurosci. 2007;10:1387–1394. doi: 10.1038/nn1997. - DOI - PubMed
    1. Ransohoff RM, Perry VH. Microglial physiology: unique stimuli, specialized responses. Annu. Rev. Immunol. 2009;27:119–145. doi: 10.1146/annurev.immunol.021908.132528. - DOI - PubMed
    1. Wu Y, Dissing-Olesen L, MacVicar BA, Stevens B. Microglia: Dynamic Mediators of Synapse Development and Plasticity. Trends Immunol. 2015;36:605–613. doi: 10.1016/j.it.2015.08.008. - DOI - PMC - PubMed
    1. Casano AM, Peri F. Microglia: multitasking specialists of the brain. Dev. Cell. 2015;32:469–477. doi: 10.1016/j.devcel.2015.01.018. - DOI - PubMed
    1. Neumann H, Kotter MR, Franklin RJ. Debris clearance by microglia: an essential link between degeneration and regeneration. Brain. 2009;132:288–295. doi: 10.1093/brain/awn109. - DOI - PMC - PubMed

Publication types