. 2017 Jul 20;8(1):84.
doi: 10.1038/s41467-017-00128-z.

Improved genome recovery and integrated cell-size analyses of individual uncultured microbial cells and viral particles

Affiliations

Improved genome recovery and integrated cell-size analyses of individual uncultured microbial cells and viral particles

Ramunas Stepanauskas et al. Nat Commun. .

Erratum in

Abstract

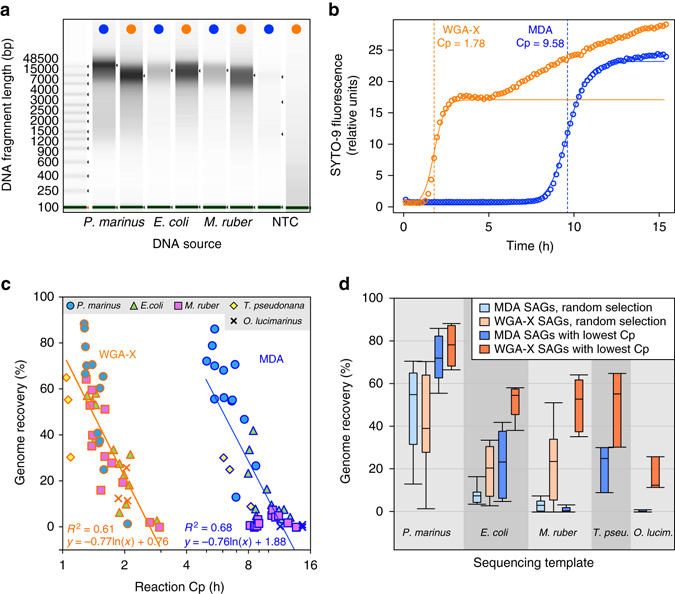
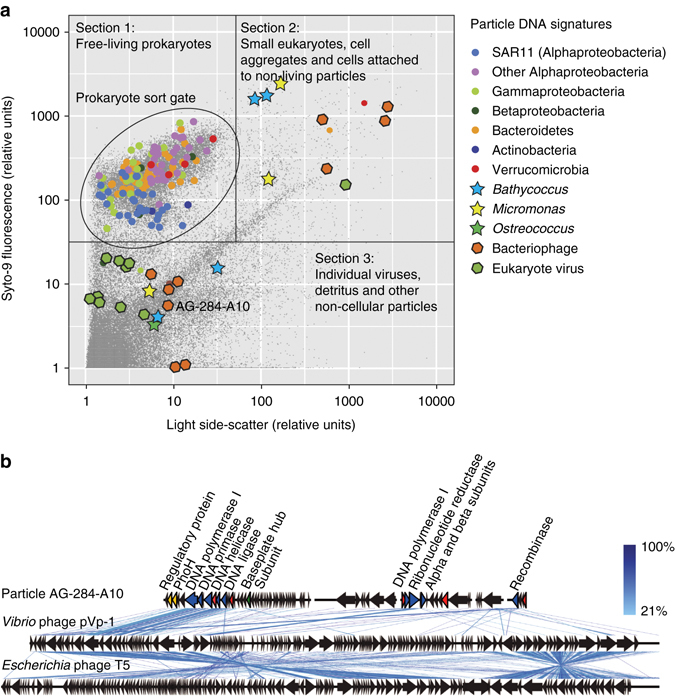
Microbial single-cell genomics can be used to provide insights into the metabolic potential, interactions, and evolution of uncultured microorganisms. Here we present WGA-X, a method based on multiple displacement amplification of DNA that utilizes a thermostable mutant of the phi29 polymerase. WGA-X enhances genome recovery from individual microbial cells and viral particles while maintaining ease of use and scalability. The greatest improvements are observed when amplifying high G+C content templates, such as those belonging to the predominant bacteria in agricultural soils. By integrating WGA-X with calibrated index-cell sorting and high-throughput genomic sequencing, we are able to analyze genomic sequences and cell sizes of hundreds of individual, uncultured bacteria, archaea, protists, and viral particles, obtained directly from marine and soil samples, in a single experiment. This approach may find diverse applications in microbiology and in biomedical and forensic studies of humans and other multicellular organisms.Single-cell genomics can be used to study uncultured microorganisms. Here, Stepanauskas et al. present a method combining improved multiple displacement amplification and FACS, to obtain genomic sequences and cell size information from uncultivated microbial cells and viral particles in environmental samples.


Conflict of interest statement

A.L. and T.P. work for Thermo Fisher Scientific, which markets several reagents that were used in this study. R.S., E.A.F., J.B., N.J.P., B.T., J.M.L., E.D.B, J.M.B., M.G.P., B.P.T., C.J.M., and W.K.B. are employees of Bigelow Laboratory for Ocean Sciences, which provides per-fee core facility services in single-cell genomics.

Figures

Fig. 1
Fig. 1
Comparison of WGA-X and MDA performance with microbial benchmark strains. a Electrophoresis gel images of WGA-X (orange dots) and MDA (blue dots) products obtained from three bacterial benchmark strains and from no-template negative controls (NTC). b Examples of WGA-X and MDA reaction kinetics, where reaction critical point (Cp) is estimated as the time required to reach the inflection point of the reaction’s exponential phase. c Correlation between reaction Cp and genome recovery from SAGs. d Average, standard deviation, and range of genome recovery from SAGs of the five benchmark strains, where SAGs were selected either at random or based on their lowest Cp values. In c and d, each bacterial strain data set derives from eight randomly selected SAGs and five SAGs with the lowest Cp; each eukaryote data set derives from three SAGs with the lowest Cp. Assemblies of bacterial and eukaryote SAGs were produced from five million and twenty million of 2 × 150 bp reads, respectively
Fig. 2
Fig. 2
Taxonomic assignments of environmental microbial SAGs. The following approaches were used: PCR-based sequencing of SSU rRNA genes followed by classification with CREST (prokaryotes) or Silva Incremental Aligner (microalgae); LoCoS followed by CheckM, Metaxa, and CREST; and a combination of the two approaches. 317 SAGs from each environment, cell type, and gDNA amplification method were analyzed
Fig. 3
Fig. 3
Results of low-coverage sequencing (LoCoS) of WGA-X and MDA SAGs of prokaryotes from a garden soil and b coastal ocean. Presented are de novo assembly sizes, G+C content, and phylogenomic assignments. A total of 317 SAGs were generated from each environment using each gDNA amplification method. The count of successful SAG assemblies is provided next to the gDNA amplification method. Insets indicate the phylogenomic assignments of SAGs within discernable G+C intervals
Fig. 4
Fig. 4
Integration of index FACS and single-cell genomics. a Flow cytometry optical properties of individual marine prokaryotes and non-cellular particles from which SAGs were generated. Section boundaries indicate tentative separation of particle types. b Genome alignments of the individual viral particle AG-284-A10 and its closest sequenced relatives Siphoviridae Vibrio phage pVp-1 (Genbank #JQ340389) and Escherichia phage T5 (Genbank AY543070). Each arrow represents a gene in the direction of transcription. Arrows represent genes related to regulation (yellow), DNA replication (blue), structure (green), unknown phage proteins (red), and hypothetical phage proteins (gray). The scale bar in b indicates peptide-sequence identity
Fig. 5
Fig. 5
Cell diameter equivalent determination of soil prokaryote cells using calibrated index FACS. a Log-linear regression between light forward scatter and cell diameter of the following laboratory cultures, with approximate cell diameters in parenthesis: P. marinus (0.5 µm), Microbacterium sp. (1 µm), E. coli (1.5 µm), and Synechococcus sp. (2.0 µm). b Light forward scatter and green fluorescence of soil Actinobacteria cells stained with SYTO-9, in the context of other particles in the sample. CD = estimated cell diameter equivalents. Colors correspond to phylogenetic groups that are shown in c. c Estimated cell diameter equivalents and the SSU rRNA gene phylogeny of Actinobacteria SAGs. Stars indicate >80% bootstrap support

References

    1. Stepanauskas R. Single cell genomics: an individual look at microbes. Curr. Opin. Microbiol. 2012;15:613–620. doi: 10.1016/j.mib.2012.09.001. - DOI - PubMed
    1. Blainey PC. The future is now: single-cell genomics of bacteria and archaea. FEMS Microbiol. Rev. 2013;37:407–427. doi: 10.1111/1574-6976.12015. - DOI - PMC - PubMed
    1. Lasken RS, McLean JS. Recent advances in genomic DNA sequencing of microbial species from single cells. Nat. Rev. Genet. 2014;15:577–584. doi: 10.1038/nrg3785. - DOI - PMC - PubMed
    1. Gawad, C., Koh, W. & Quake, S. R. Single-cell genome sequencing: current state of the science. Nat. Rev. Genet. 17, 175–188 (2016). - PubMed
    1. Navin N, et al. Tumour evolution inferred by single-cell sequencing. Nature. 2011;472:90–94. doi: 10.1038/nature09807. - DOI - PMC - PubMed

Publication types