. 2017 Jul 20;7(1):5952.
doi: 10.1038/s41598-017-06416-4.

PTEN/FOXO3/AKT pathway regulates cell death and mediates morphogenetic differentiation of Colorectal Cancer Cells under Simulated Microgravity

Affiliations

PTEN/FOXO3/AKT pathway regulates cell death and mediates morphogenetic differentiation of Colorectal Cancer Cells under Simulated Microgravity

Raj Pranap Arun et al. Sci Rep. .

Abstract

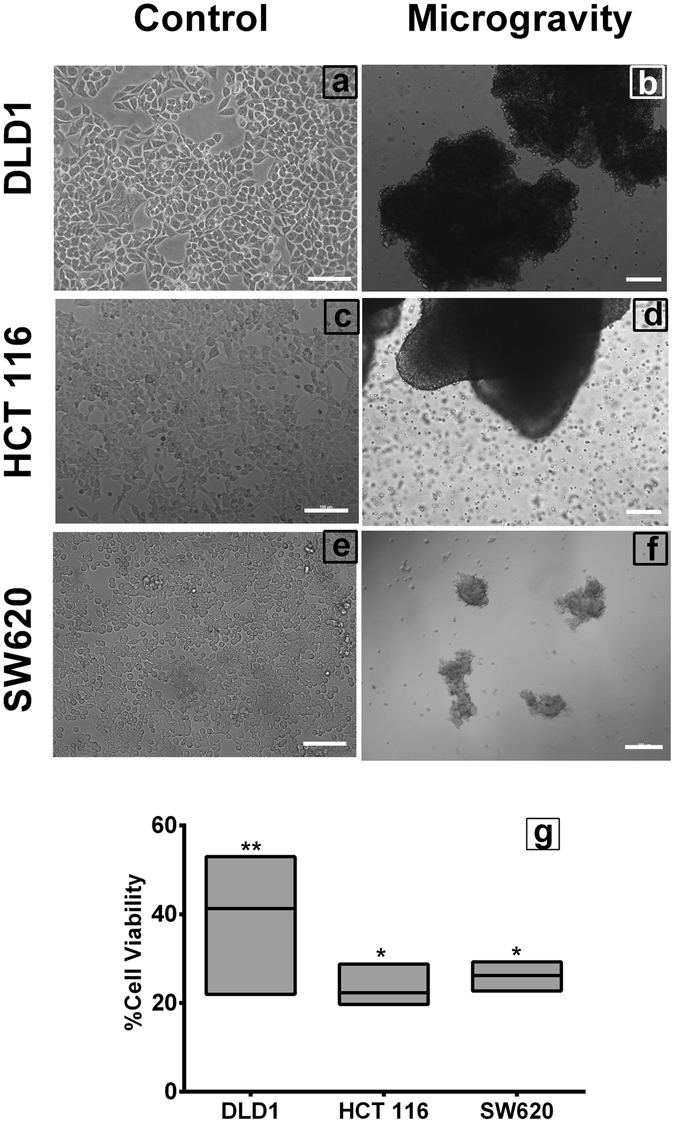
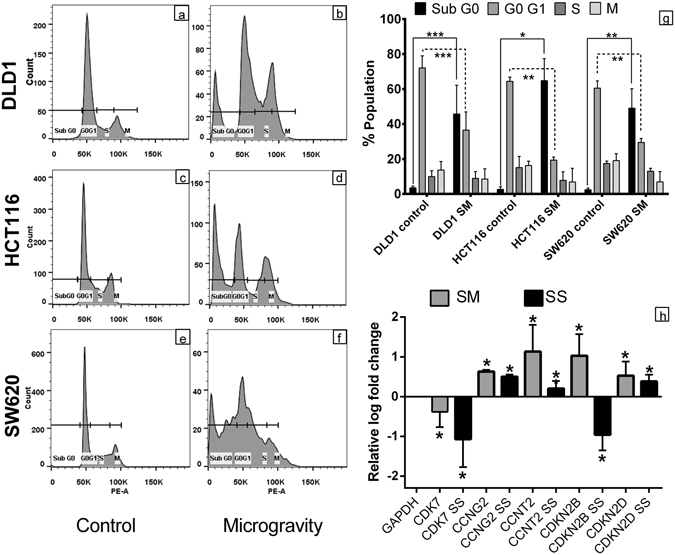
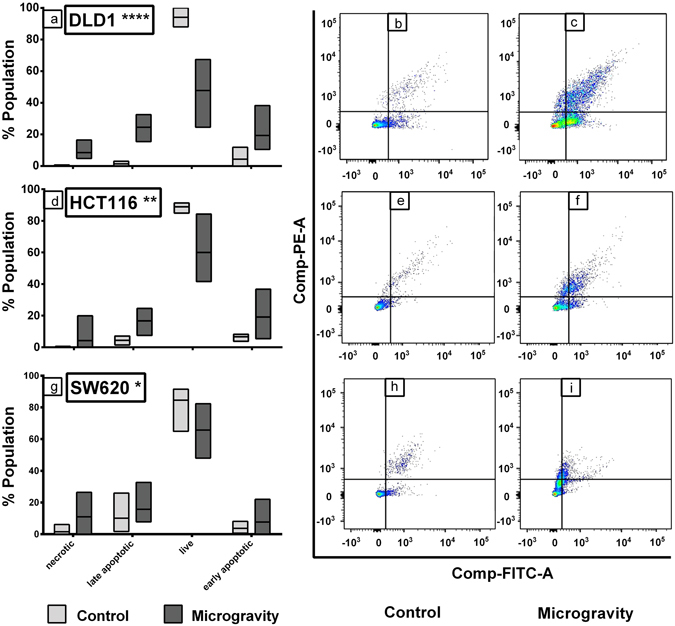
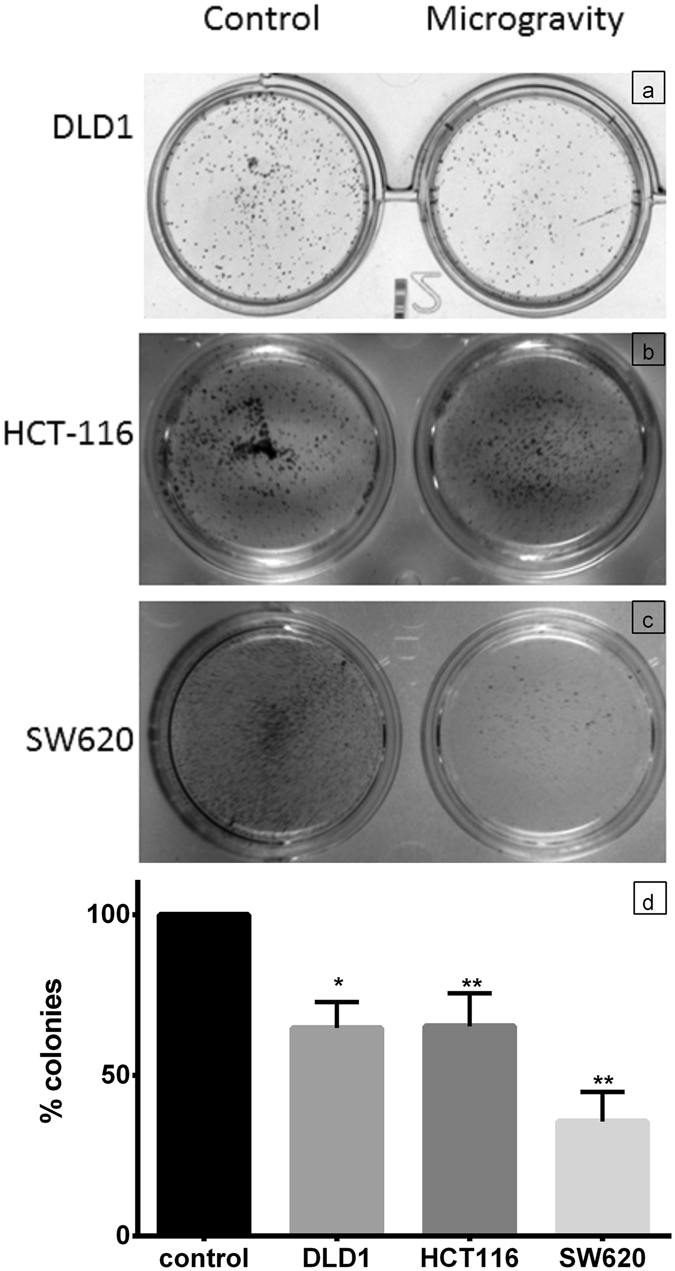
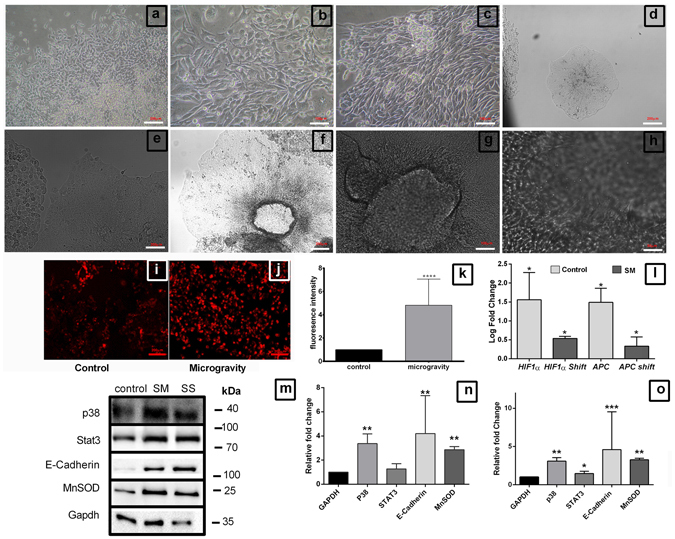
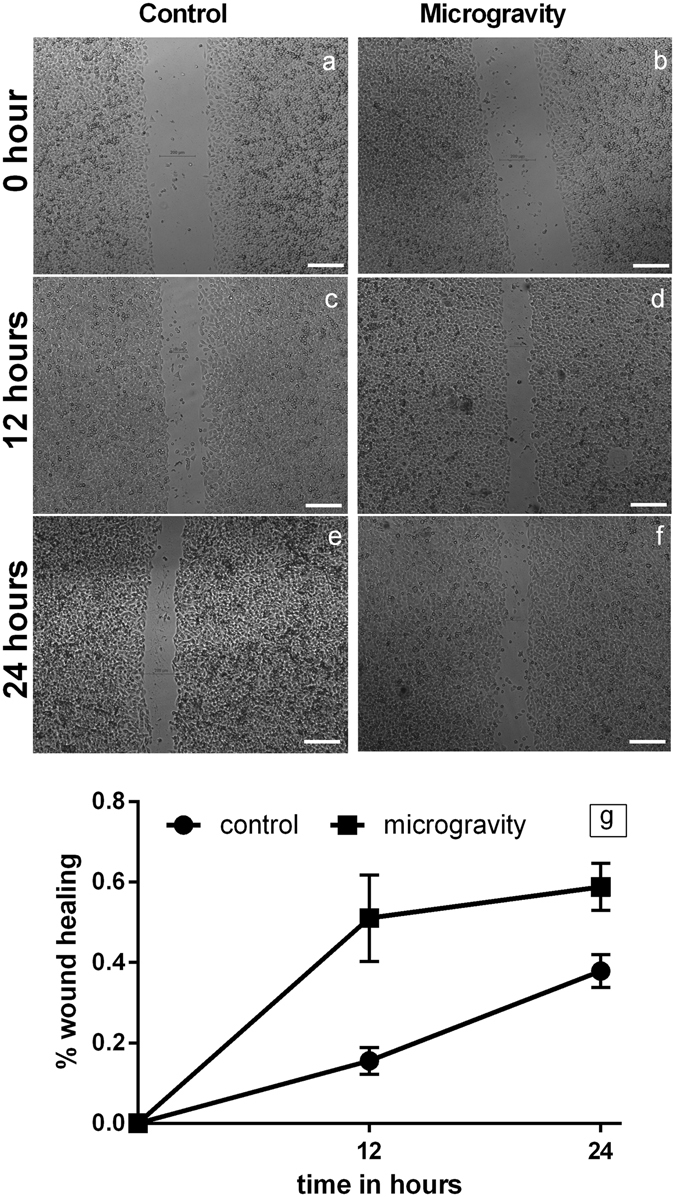
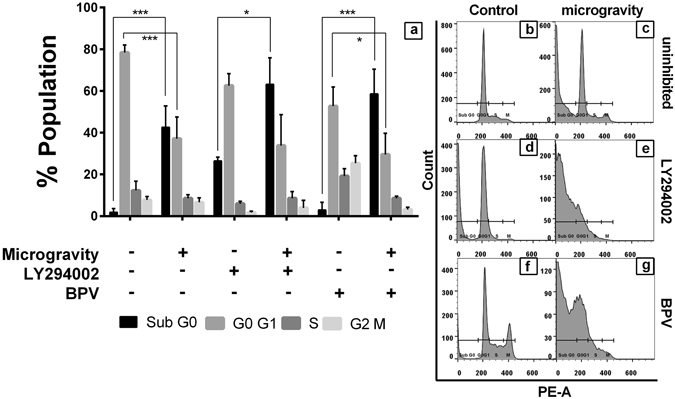
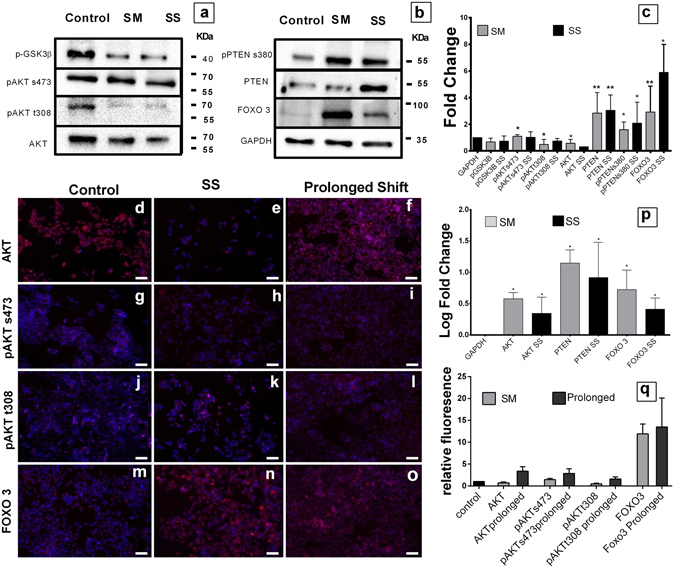
Gravity is a major physical factor determining the stress and strain around cells. Both in space experiments and ground simulation, change in gravity impacts the viability and function of various types of cells as well as in vivo conditions. Cancer cells have been shown to die under microgravity. This can be exploited for better understanding of the biology and identification of novel avenues for therapeutic intervention. Here, we described the effect of microgravity simulated using Rotational Cell Culture System-High Aspect Ratio Vessel (RCCS-HARV) on the viability and morphological changes of colorectal cancer cells. We observed DLD1, HCT116 and SW620 cells die through apoptosis under simulated microgravity (SM). Gene expression analysis on DLD1 cells showed upregulation of tumor suppressors PTEN and FOXO3; leading to AKT downregulation and further induction of apoptosis, through upregulation of CDK inhibitors CDKN2B, CDKN2D. SM induced cell clumps had elevated hypoxia and mitochondrial membrane potential that led to adaptive responses like morphogenetic changes, migration and deregulated autophagy, when shifted to normal culture conditions. This can be exploited to understand the three-dimensional (3D) biology of cancer in the aspect of stress response. This study highlights the regulation of cell function and viability under microgravity through PTEN/FOXO3/AKT pathway.


Conflict of interest statement

The authors declare that they have no competing interests.

Figures

Figure 1
Figure 1
Simulation of microgravity induces cell clumping. The colorectal cancer cells DLD1 (a), HCT116 (c) and SW620 (e), when cultured in Rotary cell culture system at 10 RPM for 48 hours to simulate microgravity clump together to form large 3D structures (b,d,f) DLD1, HCT116 and SW620 respectively. Scale bar represents 200 μm. XTT assay of the microgravity simulated cells (g) shows the cell viability was significantly reduced. The experiment was performed thrice with individual controls **P < 0.005, *P < 0.05. Data represented as mean + S.D.
Figure 2
Figure 2
Microgravity significantly increases Sub-G0 population. Microgravity alters Cell cycle in colorectal cancer cells. The individual histogram of the Propidium iodide staining in cells counted through Flow cytometer (af), shows clear shift towards Sub-G0 population in SM colorectal cancer cells DLD1, HCT116 and SW620 (b,d,f) respectively, compared to the respective controls (a,c,e). The graphical representation of the population shift during microgravity (g) in mean + S.D., Sub-G0 and G0-G1 shift in DLD1 was highly significant P < 0.0005, compared to HCT116 P < 0.05 and SW620 P < 0.005. The experiment was performed a minimum of three times with individual controls. qPCR analysis of Gene expression for CDK7, CCNG2, CCNT2, CDKN2B and CDKN2D genes between DLD1 cells subjected to SM and shifted to normal (SS) with GAPDH as housekeeping control (e), represented in log fold change of mean + S.D. *P < 0.05. The experiments were performed three times with individual controls.
Figure 3
Figure 3
Cell death in microgravity is majorly through apoptosis. The box plot for the AnnexinV FITC & PI staining for DLD1 (a), HCT116 (d) and SW620 (g) shows that major cell death during SM is induced through apoptosis. The lighter boxes represent control populations and darker ones represent SM cell populations. The data is represented as mean with data range. ****P < 0.0001, **P < 0.005, *P < 0.05 statistical analysis using two way annova. The dot plot clearly shows the cells are Annexin V FITC and PI positive cells under SM for all cell lines tested (c,f,i) compared to control cells (b,e,h).
Figure 4
Figure 4
Cell growth is hindered with SM which results in reduced colony formation. The phase contrast image of colonies formed with 1000 cells in a 24 well plate for control and SM cells of DLD1 (a), HCT116 (b) and SW620 (c) show the reduced number of colonies in simulated microgravity. The data representation as mean + S.D. (d) depicts the reduction in percentage of colonies formed. The experiment was repeated thrice, data shows that colony formation was significantly reduced. P < 0.005 for HCT 116 and SW620, while P < 0.05 for DLD1.
Figure 5
Figure 5
Adaptive responses of DLD1 to SM through differentiation. The morphogenetic effects of SM induced cell clumping, when clumps were shifted to normal culture conditions ((ac) 2 weeks, (d,e) 4 weeks, (fh) 2 months). The DLD1 cell clumps from SM, when shifted to normal conditions adhered to plate and formed colonies (scale = 200 μm) (a) which in two weeks, housed large and multinucleated cells, also cell-cell communication was profound with cell linkages (scale = 100 μm) (b) also some of the cells were polarized directionally (scale = 100 μm) (c). On prolonged culture for up to 2 months the specific features from the niche were more evident, some cells seems to retain the 3D conditioning and form rare, tightly packed colonies by 4 weeks (d) (scale = 200 μm), (e) (scale = 100 μm) which allows the cells to grow in a 3D fashion, forming cylindrical structures (f) (scale = 200 μm), these cells continuously aggregate and form large spheroid like formations (g) (scale = 100 μm) with formation of complex structures, facilitated through appendages (h) (scale = 50 μm). Mitotracker-red imaging showing the increased membrane potential in microgravity (scale = 200 μm) (i,j) and its graphical representation (k) P < 0.0005. Gene expression analysis of hypoxia related HIF1α and APC (Adenamatosis Polyposis Coli) in SM and static Shift (SS) compared against GAPDH as control (l). Data represented as mean + S.D. Western blot for proteins involved in adaptive response STAT3, P38 MAPK, MnSOD and endothelial marker E-Cadherin in SM and Shift condition (m) and the representative graph compared relative to GAPDH for SM (n) and SS (o). Experiment was performed thrice and data represented as mean + S.D. *P < 0.05, **P < 0.005, ***P < 0.001, statistical analysis done using Mann Whitney t test.
Figure 6
Figure 6
Microgravity increases cell migration. Phase contrast image of DLD1 control cells immediately after scratch from a T200 tip (a), 12 h post scratch wound (c) and 24 h post scratch wound (e). Comparative phase contrast image of SM DLD1 2 weeks post shifting to normal gravitational condition, 0 h (b), 12 h (d) and 24 h (f), scale = 200 μm. The representative graph (g) depicts 57.7% wound healing in SM after 12 hours, compared to 15.5% in control. The wound healing was 59% after 24 hours in SM compared to 38% in control.
Figure 7
Figure 7
Cell cycle analysis of AKT/PTEN inhibited cells subjected to SM. The graphical representation of the population distribution of DLD1 cells across various stages of cell cycle during SM and SM after inhibition of AKT (LY294002 10 μM) or PTEN (bpV(HOpic) 14 nM) (a). The data is represented as mean + S.D. The representative histogram of PI intensity for control DLD1 (b), SM (c), AKT inhibition (d) and SM after AKT inhibition (e), PTEN inhibition (f) and SM after PTEN inhibition (g) shows clear shift in the PI intensity with each treatment.
Figure 8
Figure 8
The PTEN/FOXO3/AKT axis regulation under microgravity. Images of Western blot for AKT pathway proteins; phosphorylated GSK-3β serine 9, phosphorylated AKTserine 473, phosphorylated AKT threonine 308 and total AKT of control, Microgravity simulated and SM cells shifted to normal gravity for 4 days (SS) (a). Western Blot images of phosphorylated PTEN serine 308, PTEN, FOXO3 and GAPDH (b). Representative graph normalized using GAPDH; black bars represent SS and lighter bars represent SM (c). Data represented as mean + S.D. statistical analysis using Mann Whitney t test *P < 0.05, **P < 0.005. Fluoresecnt images of DLD1 cells stained with PE conjugated secondary against AKT, pAKTs473, pAKTt308 and FOXO3, nucleus counterstained with DAPI, control (d,g,j,m) respectively and SS cells (e,h,k,n) and SM cells prolonged in static for longer period 2 months (f,i,l,o) scale bar = 200 μm. qPCR analysis of Gene expression of AKT, PTEN, FOXO genes against GAPDH as housekeeping in control vs SM and SS, represented in log fold change of mean + S.D. *P < 0.05 (p). Graphical representation for the images (do) showing relative fluorescence intensity between control, SS and prolonged shift cells (q).

References

    1. Brenner H, Kloor M, Pox CP. Colorectal cancer. The Lancet. 2014;383:1490–1502. doi: 10.1016/S0140-6736(13)61649-9. - DOI - PubMed
    1. Discher D, et al. Biomechanics: cell research and applications for the next decade. Ann Biomed Eng. 2009;37:847–859. doi: 10.1007/s10439-009-9661-x. - DOI - PMC - PubMed
    1. Alexei V, et al. Lowering of tumor interstitial fluid pressure specifically augments efficacy of chemotherapy. The FASEB Journal. 2003;17:1756–1758. - PubMed
    1. Sun J, et al. Biomechanical profile of cancer stem-like cells derived from MHCC97H cell lines. J Biomech. 2016;49:45–52. doi: 10.1016/j.jbiomech.2015.11.007. - DOI - PubMed
    1. Vassy J, et al. Schoevaer. Weightlessness Acts On Human Breast Cancer Cell Line MCF7. Advances in Space Research. 2003;32:1595–1603. doi: 10.1016/S0273-1177(03)90400-5. - DOI - PubMed

Publication types

Substances