. 2017 Jul 20;7(1):6060.
doi: 10.1038/s41598-017-06177-0.

Structure of general-population antibody titer distributions to influenza A virus

Affiliations

Structure of general-population antibody titer distributions to influenza A virus

Nguyen Thi Duy Nhat et al. Sci Rep. .

Abstract

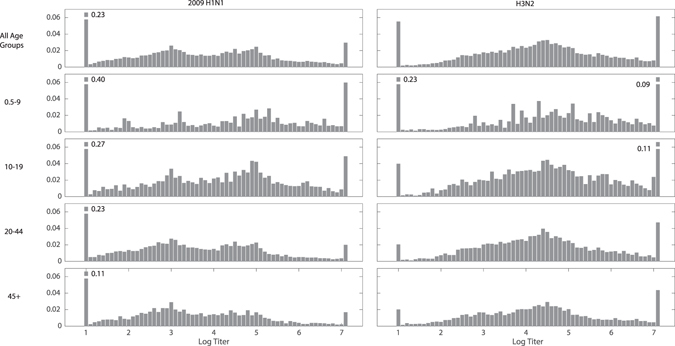
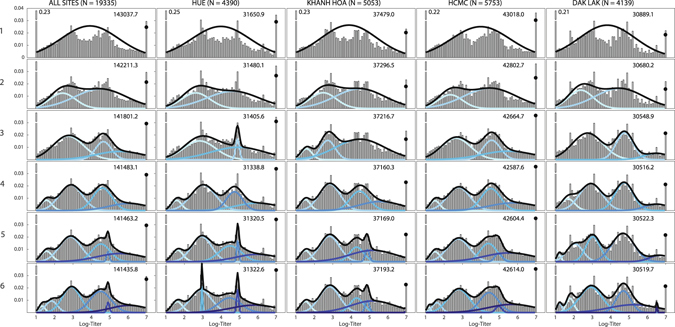
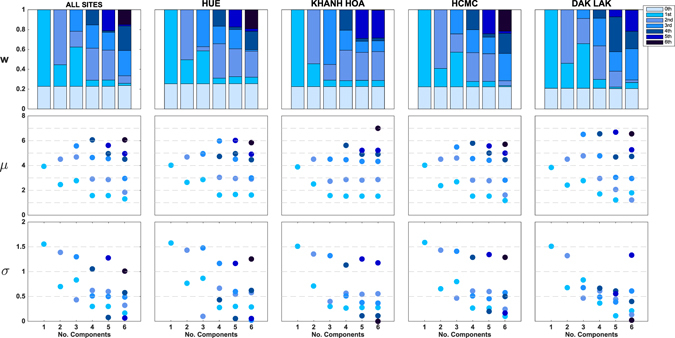
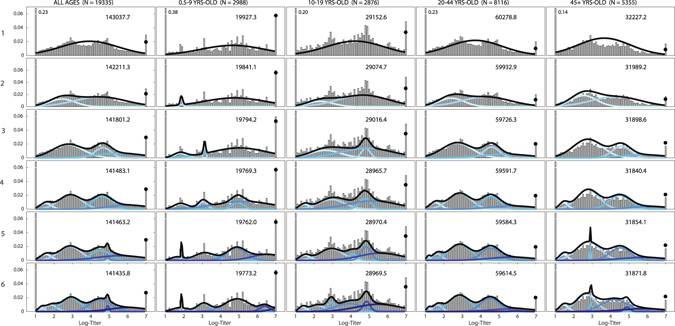
Seroepidemiological studies aim to understand population-level exposure and immunity to infectious diseases. Their results are normally presented as binary outcomes describing the presence or absence of pathogen-specific antibody, despite the fact that many assays measure continuous quantities. A population's natural distribution of antibody titers to an endemic infectious disease may include information on multiple serological states - naiveté, recent infection, non-recent infection, childhood infection - depending on the disease in question and the acquisition and waning patterns of immunity. In this study, we investigate 20,152 general-population serum samples from southern Vietnam collected between 2009 and 2013 from which we report antibody titers to the influenza virus HA1 protein using a continuous titer measurement from a protein microarray assay. We describe the distributions of antibody titers to subtypes 2009 H1N1 and H3N2. Using a model selection approach to fit mixture distributions, we show that 2009 H1N1 antibody titers fall into four titer subgroups and that H3N2 titers fall into three subgroups. For H1N1, our interpretation is that the two highest-titer subgroups correspond to recent and historical infection, which is consistent with 2009 pandemic attack rates. Similar interpretations are available for H3N2, but right-censoring of titers makes these interpretations difficult to validate.


Conflict of interest statement

MFB has been a paid consultant to Visterra Inc in Cambridge MA.

Figures

Figure 1
Figure 1
Antibody titer histograms for n = 20,152 individuals, plotted for all ages (top panels) and by age group (bottom four panels). Titers shown are to the HA1 components of the 2009 H1N1 pandemic influenza virus (left column) and to recently circulating H3N2 viruses (right column). The fractions of individuals with titers below the detection limit of 20 and above 1280 that were out of the plotting ranges are given next to the respective bar. Histograms were weighted to adjust for age and gender according to the Vietnam national housing census in 2009 for the four collection sites.
Figure 2
Figure 2
Titer histograms for 2009 H1N1, showing fit results for mixture models with different numbers of normal components (top to bottom; the label to the left of the y‐axis is the number of mixture components) and grouped by collection sites. Histograms are weighted to adjust for age and gender according to the Vietnam national housing census in 2009 for each of the four collection sites. The blue lines in each panel are the normalized probability density functions of the component distributions with darker colors used for increasing μ. The black lines show the full mixture distribution density, and the black dots are the estimated cumulative distribution of the mixture models at 7.0 (titer of 1280). The numbers in the upper right corner of each panel are the BIC scores of the model fits. The fractions of individuals with titers below the detection limit of 20 and above 1280 that were out of the plotting ranges were given next to their respective bars.
Figure 3
Figure 3
Visualization of model selection process for 2009 H1N1 titer-distribution models from Fig. 2. The y-axes show the fitted values of w i (mixture weights), μ i (means), and σ i (standard deviations). Components’ shades were ranked from lightest to darkest in the order of increasing μ. In the top panel, the “0th component” represents the point mass w 0 placed at 20 for titers below the lower detection limit of 20. Note that in many cases for five or six components, the weights or standard deviation parameters are close to zero; for some cases, two of the inferred mean parameters are very close to each other.
Figure 4
Figure 4
Titer histograms and fit results for mixture models with different numbers of components (label on the left is the number of mixture components) and grouped by different age groups recommended by the CONCISE (http://consise.tghn.org/) consortium for 2009 H1N1 influenza. Histograms are weighted to adjust for age and gender according to the Vietnam national housing census in 2009. The numbers in the upper right corner of each panel are the fitted BIC scores of the respective model. For each panel, the blue lines are the normalized probability density of the component distributions with darker colors used for increasing μ. Black lines are the total mixture distribution density; and the black dots are estimated probability weight of the mixture model for titers ≥7.0. The fractions of individuals with titers below the detection limit of 20 and above 1280 that were out of the plotting ranges are shown next to their respective bars.

References

    1. Boni MF, et al. Population-level antibody estimates to novel influenza A/H7N9. J Infect Dis. 2013;208:554–558. doi: 10.1093/infdis/jit224. - DOI - PMC - PubMed
    1. Todd S, de Bruin E, Nhat NTD, Koopmans M, Boni MF. Reply to Pawar et al–Immunity Status Against Influenza A Subtype H7N9 and Other Avian Influenza Viruses in a High-Risk Group and the General Population in India. J Infect Dis. 2014;210:161–163. doi: 10.1093/infdis/jiu034. - DOI - PubMed
    1. Todd, S. Influenza in Vietnam: cross immunity from prior infection and its effect on population-level estimates of infection. (University of Liverpool and Liverpool School of Tropical Medicine, PhD Thesis, 2016).
    1. Steens A, et al. Age-dependent patterns of infection and severity explaining the low impact of 2009 influenza A (H1N1): Evidence from serial serologic surveys in the Netherlands. Am J Epid. 2011;174:1307–1315. doi: 10.1093/aje/kwr245. - DOI - PubMed
    1. Chen MIC, et al. 2009 Influenza A(H1N1) Seroconversion Rates and Risk Factors Among Distinct Adult Cohorts in Singapore. J Am Med Assoc. 2010;303:1383–1391. doi: 10.1001/jama.2010.404. - DOI - PubMed

Publication types

MeSH terms

Substances