. 2017 Jun;3(2):18.
doi: 10.3390/ncrna3020018. Epub 2017 Mar 24.

Assessment of isomiR Discrimination Using Commercial qPCR Methods

Affiliations

Assessment of isomiR Discrimination Using Commercial qPCR Methods

Rogan Magee et al. Noncoding RNA. 2017 Jun.

Abstract

We sought to determine whether commercial quantitative polymerase chain reaction (qPCR) methods are capable of distinguishing isomiRs: variants of mature microRNAs (miRNAs) with sequence endpoint differences. We used two commercially available miRNA qPCR methods to quantify miR-21-5p in both synthetic and real cell contexts. We find that although these miRNA qPCR methods possess high sensitivity for specific sequences, they also pick up background signals from closely related isomiRs, which influences the reliable quantification of individual isomiRs. We conclude that these methods do not possess the requisite specificity for reliable isomiR quantification.

Keywords: isomiR; miRNA; qPCR; short non-coding RNA.


Conflict of interest statement

Conflicts of Interest: The authors declare no conflict of interest.

Figures

Figure 1
Figure 1
Heatmap of short RNA-seq mean RPM values across 32 TCGA projects. To assess the level of miR-21-5p isomiRs that are closely related to hsa-miR-21-5p 0|0, we calculated the mean abundance of n = 20 isomiRs across n = 32 TCGA projects. The mean was calculated using all sample types available in each project (specifically: tumor, normal, blood based, or metastasis). We plot a heatmap, where the intensity of purple in each cell represents the log2 mean RPM for that isomiR in that cancer. isomiRs are labeled by the color with which we denote them in later experiments (right). The lower panel shows the log2 fold difference between the level of hsa-miR-21-5p 0|0 in each TCGA project versus the absolute minimum mean observed in ovarian cancer (OV) (mean RPM = 6382.92). Errors bars show propagated formula for the Standard Error of the Mean.
Figure 2
Figure 2
miRNA qPCR with pooled synthetic oligo RNAs: “synthetic cell lines.” To determine the specificity of both Exiqon LNA miRCuRY PCR and ThermoFisher Taqman miRNA qPCR, we combined the four isomiRs of hsa-miR-21-5p (Table 1) such that we formed four pools in which each one of the isomiRs in turn was present at five times the concentration of the other three. We then performed one RT and three qPCR replicates with each technique. Panel (a) shows the results for LNA qPCR, while panel (b) shows the results for Taqman qPCR. Colored bars show the Ct value for each of the synthetic pools, while grey bars show the expected Ct value for each pool. Three stars (***) indicate a p-value ≤ 0.001, while two stars (**) indicate a p-value ≤ 0.01.
Figure 3
Figure 3
miRNA qPCR with pooled synthetic oligo RNAs: “synthetic cell lines.” To determine the specificity of both Exiqon LNA miRCuRY PCR and ThermoFisher Taqman miRNA qPCR, we combined the four isomiRs of hsa-miR-21-5p (Table 1) such that we formed four pools in which each one of the isomiRs in turn was present at five times the concentration of the other three. We then performed one RT and three qPCR replicates with each technique. Panel (a) shows the results for LNA qPCR, while panel (b) shows the results for Taqman qPCR. Colored bars show the Ct value for each of the synthetic pools, while grey bars show the expected Ct value for each pool. Three stars (***) indicate a p-value ≤ 0.001, while two stars (**) indicate a p-value ≤ 0.01.
Figure 4
Figure 4
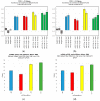
miRNA qPCR detection with transfected HEK293T cells. To determine the specificity of both Exiqon LNA miRCuRY PCR (a) and ThermoFisher Taqman miRNA qPCR (b), we transfected miRNA mimics of each of the four isomiRs of hsa-miR-21-5p that we studied into HEK293T cells in triplicate (see Table 1). We then performed one RT and three qPCR replicates with extracted RNA from each of the transfections. Panel (a) shows the 2−∆∆Ct values for the Exiqon LNA method, calculated using the average of the three negative control experiments as the reference for the delta-delta Ct calculation. Panel (b) shows the same calculation for the ThermoFisher miRNA qPCR experiment. Panels (c) and (d) serve as quality control for the transfection. Panel (c) shows the results of Exiqon LNA method qPCR after using each miRVana mimic alone as template RNA for the RT reaction. Panel (d) shows the results of Exiqon LNA method qPCR after using each miRVana mimic, together with total RNA extracted from MD-MB-468 cells, as template RNA for the reverse transcriptase (RT) reaction.
Figure 5
Figure 5
Comparison of the sign of the ratio of the 0|0 to the −1|0 across The Cancer Genome Atlas (TCGA). We analyzed 10,274 short RNA-seq datasets and found that 223 mature miRNAs show expression for both 0|0 and −1|0 isomiRs in at least 1 of the 32 TCGA projects. We then compared the mean RPM of these isomiRs and pooled our observations of 223 isomiR pairs across 32 cancers into four categories: white: both isomiRs are absent from this project; blue: the −1|0 isomiR is more abundant than the 0|0; red: the 0|0 isomiR is more abundant than the −1|0, which is also present; green: the 0|0 isomiR is more abundant than the −1|0, which is entirely absent. We plot the resultant observations as a heatmap, showing that most mature miRNAs predominantly express the 0|0 isomiR at high abundance across the TCGA, but that a significant portion show the reverse pattern of expression.

References

    1. Bartel D.P. MicroRNAs: Genomics, biogenesis, mechanism, and function. Cell. 2004;116:281–297. doi: 10.1016/S0092-8674(04)00045-5. - DOI - PubMed
    1. Kozomara A., Griffiths-Jones S. Mirbase: Annotating high confidence microRNAs using deep sequencing data. Nucleic Acids Res. 2014;42:D68–D73. doi: 10.1093/nar/gkt1181. - DOI - PMC - PubMed
    1. Bartel D.P. MicroRNAs: Target recognition and regulatory functions. Cell. 2009;136:215–233. doi: 10.1016/j.cell.2009.01.002. - DOI - PMC - PubMed
    1. Djuranovic S., Nahvi A., Green R. Mirna-mediated gene silencing by translational repression followed by mrna deadenylation and decay. Science. 2012;336:237–240. doi: 10.1126/science.1215691. - DOI - PMC - PubMed
    1. Cui Q., Yu Z., Purisima E.O., Wang E. Principles of microrna regulation of a human cellular signaling network. Mol. Syst. Biol. 2006;2:46. doi: 10.1038/msb4100089. - DOI - PMC - PubMed

LinkOut - more resources