. 2017 Jul 21:6:e23421.
doi: 10.7554/eLife.23421.

Defining the biological basis of radiomic phenotypes in lung cancer

Affiliations

Defining the biological basis of radiomic phenotypes in lung cancer

Patrick Grossmann et al. Elife. .

Abstract

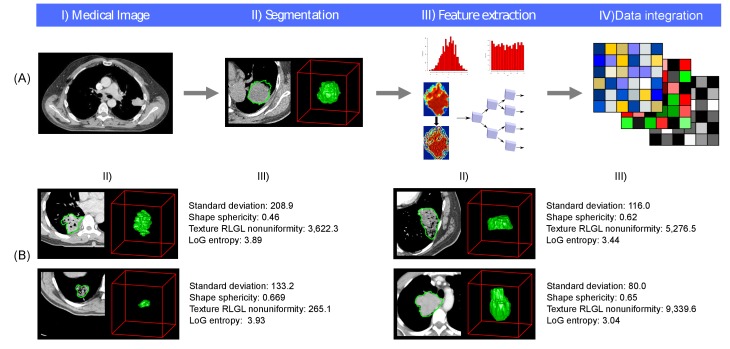
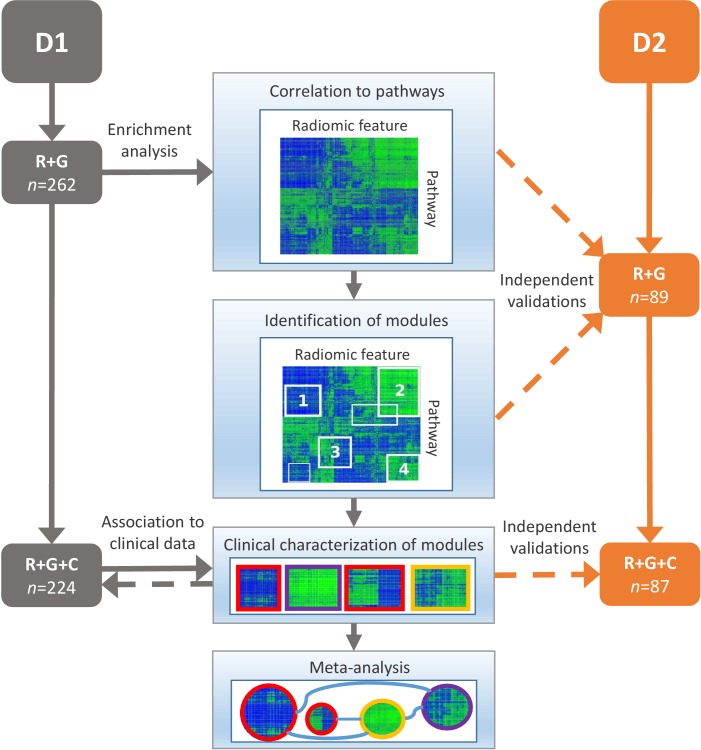
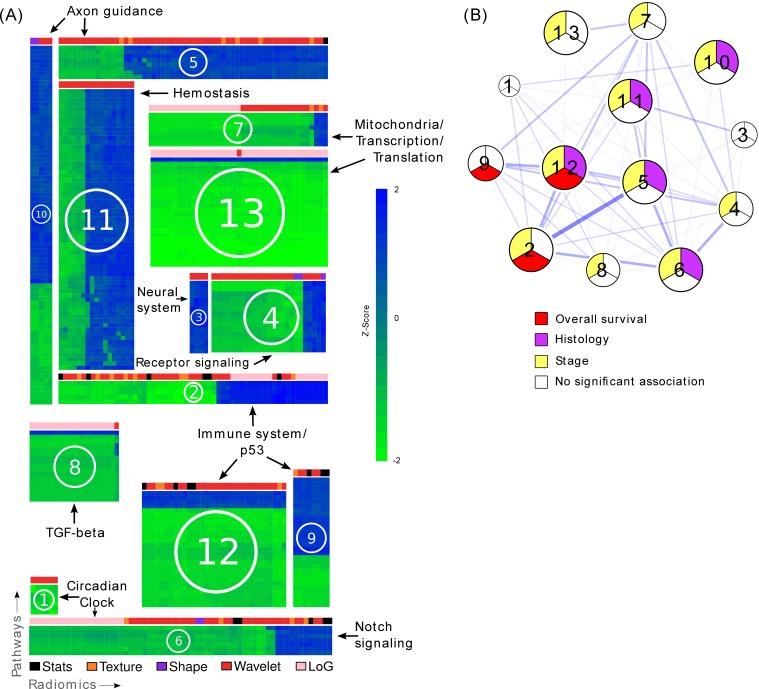
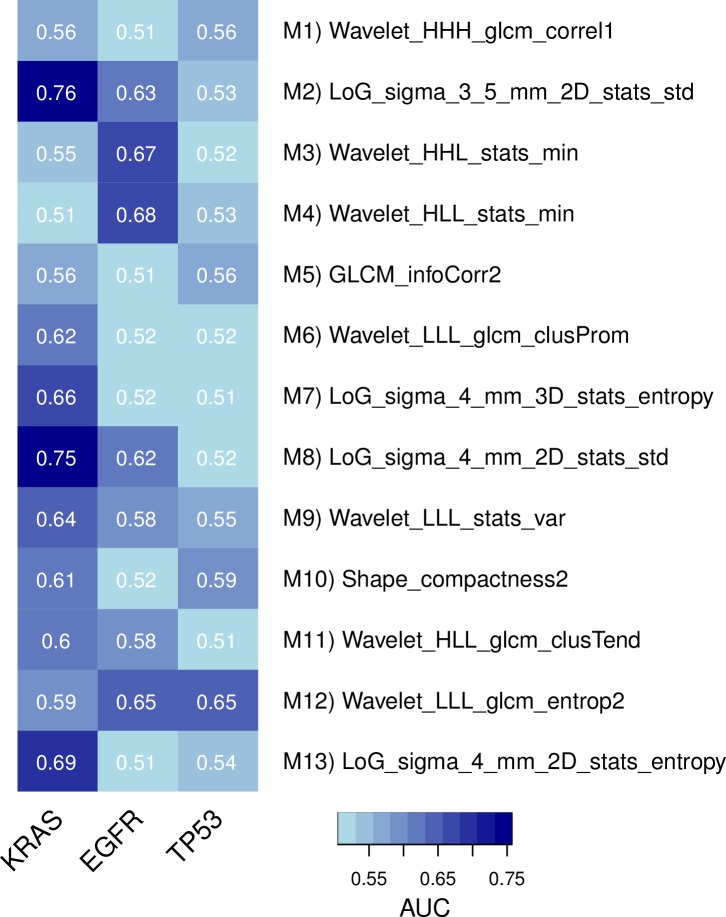
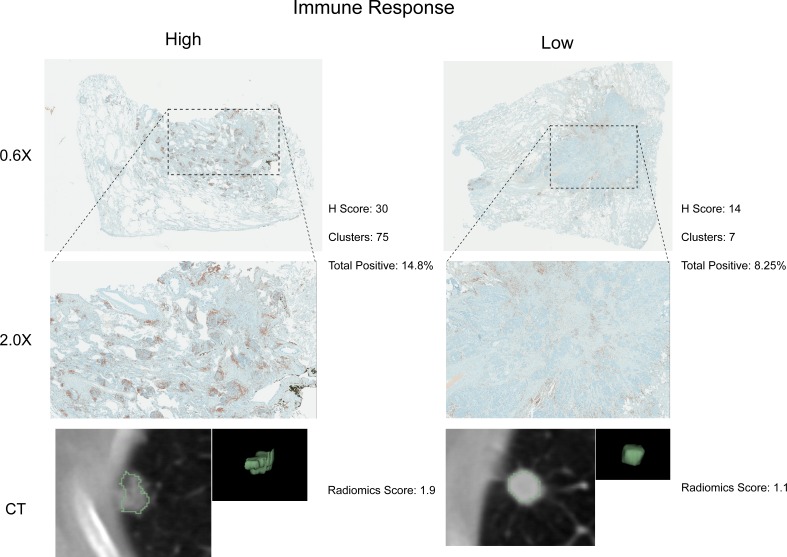
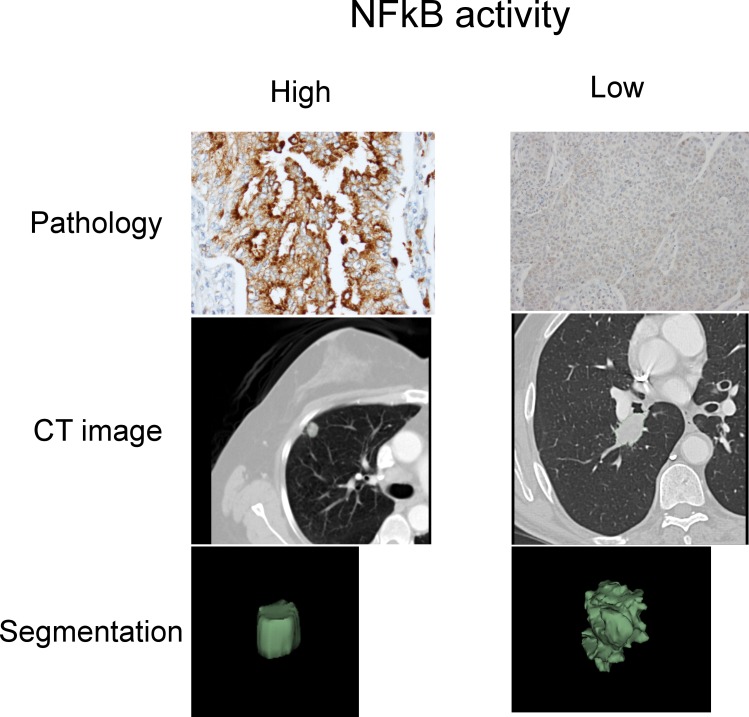
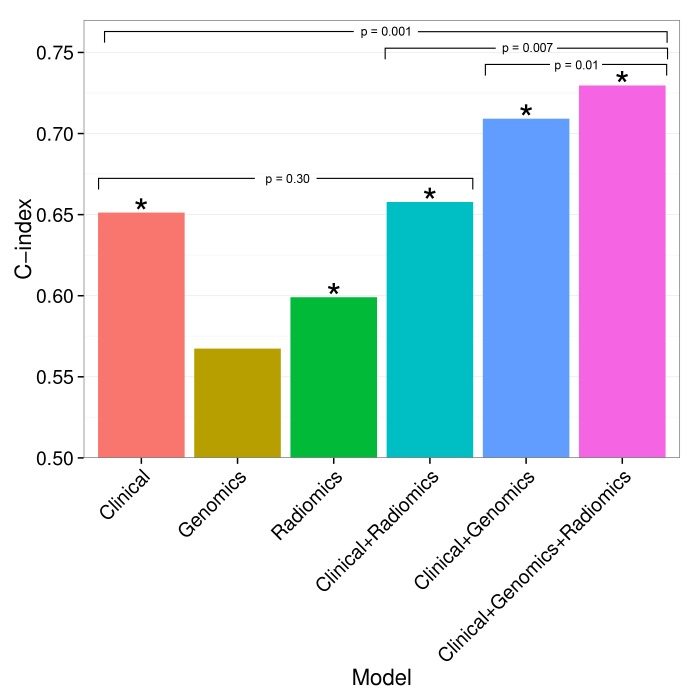
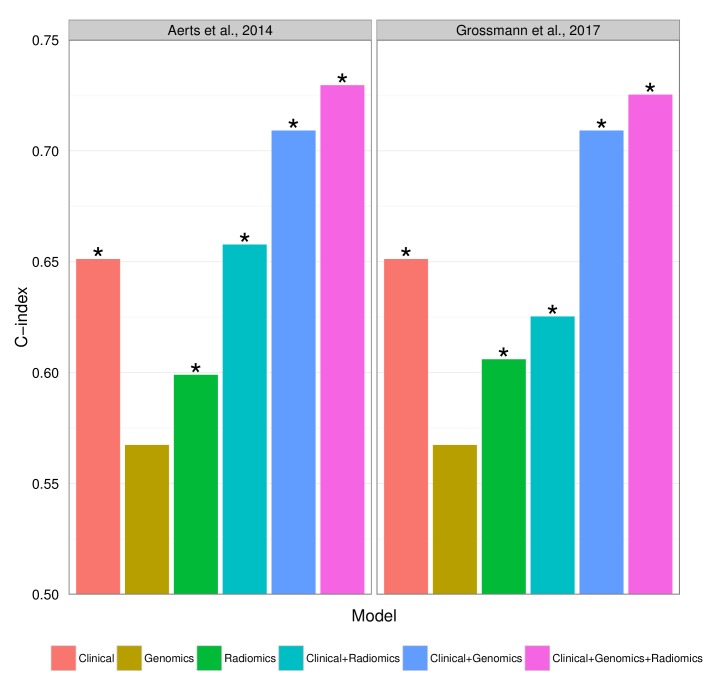
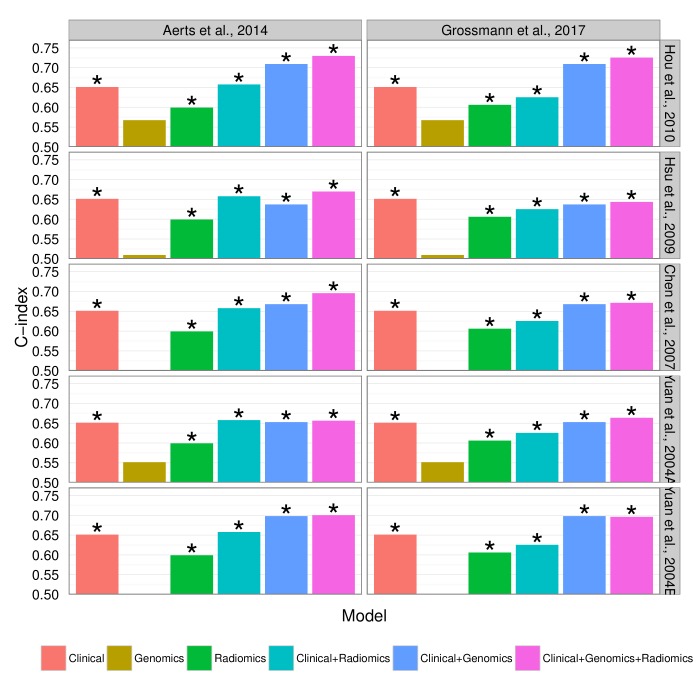
Medical imaging can visualize characteristics of human cancer noninvasively. Radiomics is an emerging field that translates these medical images into quantitative data to enable phenotypic profiling of tumors. While radiomics has been associated with several clinical endpoints, the complex relationships of radiomics, clinical factors, and tumor biology are largely unknown. To this end, we analyzed two independent cohorts of respectively 262 North American and 89 European patients with lung cancer, and consistently identified previously undescribed associations between radiomic imaging features, molecular pathways, and clinical factors. In particular, we found a relationship between imaging features, immune response, inflammation, and survival, which was further validated by immunohistochemical staining. Moreover, a number of imaging features showed predictive value for specific pathways; for example, intra-tumor heterogeneity features predicted activity of RNA polymerase transcription (AUC = 0.62, p=0.03) and intensity dispersion was predictive of the autodegration pathway of a ubiquitin ligase (AUC = 0.69, p<10-4). Finally, we observed that prognostic biomarkers performed highest when combining radiomic, genetic, and clinical information (CI = 0.73, p<10-9) indicating complementary value of these data. In conclusion, we demonstrate that radiomic approaches permit noninvasive assessment of both molecular and clinical characteristics of tumors, and therefore have the potential to advance clinical decision-making by systematically analyzing standard-of-care medical images.

Keywords: cancer biology; computational biology; genomics; human; imaging; oncology; radiomics; systems biology.


Conflict of interest statement

RJG: declares a collaboration with HealthMyne.

The other authors declare that no competing interests exist.

Figures

Figure 1.
Figure 1.. Radiomics approach.
(A) Workflow of extracting radiomic features: (I) A lung tumor is scanned in multiple slices. (II) Next, the tumor is delineated in every slice and validated by an experienced physician. This allows creation of a 3D representation of the tumor outlining phenotypic differences of tumors. (III) Radiomic features are extracted from this 3D mask, and (IV) integrated with genomic and clinical data. (B) Representative examples of lung cancer tumors. Visual and nonvisual differences in tumor shape and texture between patients can be objectively defined by radiomics features, such as entropy of voxel intensity values (‘How heterogeneous is the tumor?') or sphericity of the tumor (‘How round is the tumor?'). DOI: http://dx.doi.org/10.7554/eLife.23421.003
Figure 2.
Figure 2.. Schema of our strategy to define robust radiomic-pathway-clinical relationships.
Two independent lung cancer cohorts (D1 and D2) with radiomic (R), genomic (G), and clinical (C) data were analyzed. D1 (n = 262) was used as a discovery cohort and D2 (n = 89) was used to validate our findings. A gene set enrichment analysis (GSEA) approach assessed scores for radiomic-pathway associations. These scores were biclustered to modules that contain features and pathways with coherent expression patterns. These modules may overlap and vary in size. Clinical association to overall survival (red), pathologic histology (purple), and TNM stage (yellow) was statistically tested in both datasets, and results were combined in a meta-analysis to investigate relationships of modules. DOI: http://dx.doi.org/10.7554/eLife.23421.004
Figure 3.
Figure 3.. Radiomic-pathway-clinical modules.
(A) Clustering of significantly validated radiomic-pathway association modules (FDR < 0.05). Normalized enrichment scores (NESs) have been biclustered to coherently expressed modules. Every heatmap in this figure corresponds to a module (M1 - M13) with radiomic features in columns and pathways in rows. Heatmap sizes are proportional to module sizes. Elements are NESs given in Z-scores across features, and are displayed in blue when positive and green when negative. Horizontal color bars above every module indicate radiomic feature groups (black = first order statistics, orange = texture, purple = shape, red = wavelet, and pink = Laplace of Gaussian). Representative molecular pathways are displayed. (B) Clinical module network. We investigated if modules were associated with overall survival (red), stage (yellow), histology (purple), or no clinical factor (white). Relationships of modules based on their number of shared radiomic features (thickness of blue lines) are displayed by a network. While we found that most modules yield clinical information, overlaps of modules did not indicate relationships to similar clinical factors. DOI: http://dx.doi.org/10.7554/eLife.23421.008
Figure 3—figure supplement 1.
Figure 3—figure supplement 1.. Predictive capabilities of representative radiomic features from every module for genetic mutations in KRAS, EGFR, and TP53 in a subset of the discovery cohort.
DOI: http://dx.doi.org/10.7554/eLife.23421.010
Figure 3—figure supplement 2.
Figure 3—figure supplement 2.. Association of representative features with smoking history in a subset of the discovery cohort.
DOI: http://dx.doi.org/10.7554/eLife.23421.011
Figure 4.
Figure 4.. Test for agreement between radiomic and pathological immune response assessment.
Two representative cases are shown where radiomic predictions of immune response were confirmed by immunohistochemical staining for nuclear CD3 highlighting lymphocytes in brown. Each case is displayed in 0.6X and 2.0X magnification of the tumor slides, and an axial slice of the corresponding diagnostic CT scan and the total tumor volume is given for comparison. Automated quantifications of lymphocytes are displayed in addition to the radiomics score incorporated to classify into high and low responders. DOI: http://dx.doi.org/10.7554/eLife.23421.015
Figure 4—figure supplement 1.
Figure 4—figure supplement 1.. Representative cases of immunohistochemical staining for RelA.
DOI: http://dx.doi.org/10.7554/eLife.23421.016
Figure 5.
Figure 5.. Combining prognostic signatures for overall survival.
We tested combinations of clinical, genomic, and radiomic signatures. To a clinical Cox proportional-hazards regression model with stage and histology, we first added a published gene signature and next a published radiomic signature. These models were fitted on Dataset1 and evaluated with the C-index (CI) on Dataset2. An asterisk indicates significance (p<0.05). Combining different data types resulted in increased prognostic performances. By adding radiomic and genomic information, the initial performance of the clinical model was increased from CI = 0.65 (Noether p=0.001) to CI = 0.73 (p=2×10⁻⁹). DOI: http://dx.doi.org/10.7554/eLife.23421.017
Figure 5—figure supplement 1.
Figure 5—figure supplement 1.. Prognostic performance of two radiomic signatures (i.e., a previously published and a novel signature) combined with genetic and clinical information.
DOI: http://dx.doi.org/10.7554/eLife.23421.018
Figure 5—figure supplement 2.
Figure 5—figure supplement 2.. Prognostic performance of two radiomic signatures combined with different gene signatures and clinical information.
DOI: http://dx.doi.org/10.7554/eLife.23421.019

Comment in

References

    1. Aerts HJ, Velazquez ER, Leijenaar RT, Parmar C, Grossmann P, Carvalho S, Cavalho S, Bussink J, Monshouwer R, Haibe-Kains B, Rietveld D, Hoebers F, Rietbergen MM, Leemans CR, Dekker A, Quackenbush J, Gillies RJ, Lambin P. Decoding tumour phenotype by noninvasive imaging using a quantitative radiomics approach. Nature Communications. 2014;5:4006. doi: 10.1038/ncomms5006. - DOI - PMC - PubMed
    1. Aerts HJ. The potential of radiomic-based phenotyping in precision medicine: a review. JAMA Oncology. 2016;2:1636. doi: 10.1001/jamaoncol.2016.2631. - DOI - PubMed
    1. Aerts HJ, Grossmann P, Tan Y, Oxnard GG, Rizvi N, Schwartz LH, Zhao B. Defining a radiomic response phenotype: a pilot study using targeted therapy in NSCLC. Scientific Reports. 2016;6:33860. doi: 10.1038/srep33860. - DOI - PMC - PubMed
    1. Ahrendt SA, Hu Y, Buta M, McDermott MP, Benoit N, Yang SC, Wu L, Sidransky D. p53 mutations and survival in stage I non-small-cell lung Cancer: results of a prospective study. JNCI Journal of the National Cancer Institute. 2003;95:961–970. doi: 10.1093/jnci/95.13.961. - DOI - PubMed
    1. Balagurunathan Y, Gu Y, Wang H, Kumar V, Grove O, Hawkins S, Kim J, Goldgof DB, Hall LO, Gatenby RA, Gillies RJ. Reproducibility and prognosis of quantitative features extracted from CT Images. Translational Oncology. 2014;7:72–87. doi: 10.1593/tlo.13844. - DOI - PMC - PubMed

Publication types

MeSH terms

Substances