. 2017;59(4):1153-1169.
doi: 10.3233/JAD-161148.

Neuroimaging Feature Terminology: A Controlled Terminology for the Annotation of Brain Imaging Features

Affiliations

Neuroimaging Feature Terminology: A Controlled Terminology for the Annotation of Brain Imaging Features

Anandhi Iyappan et al. J Alzheimers Dis. 2017.

Abstract

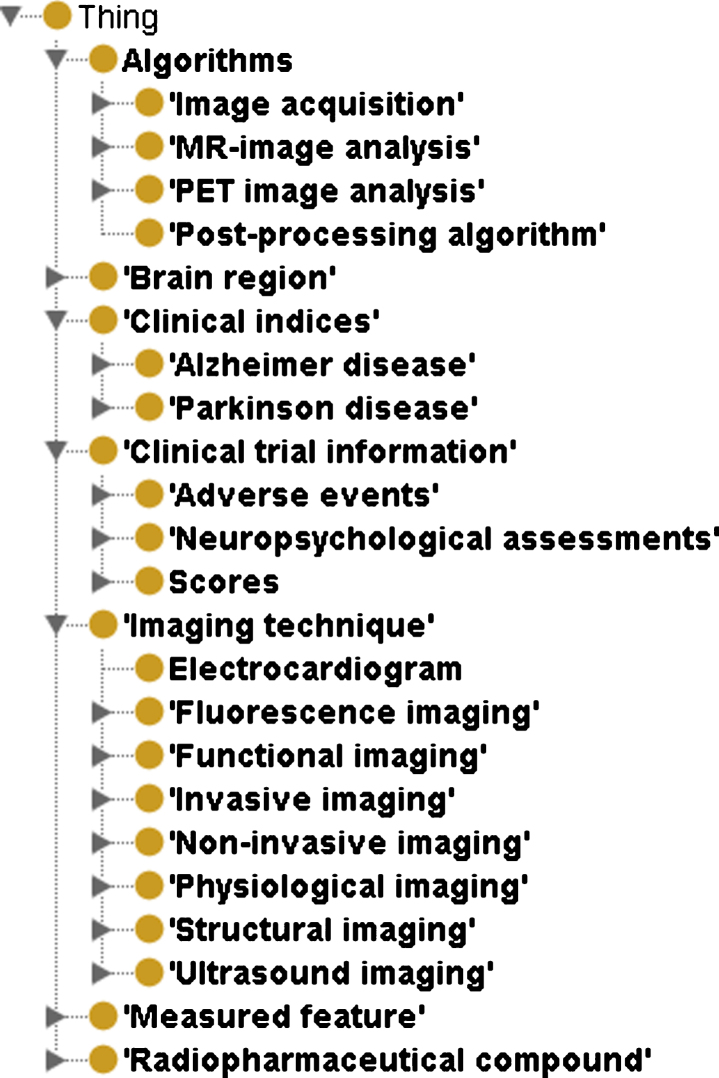
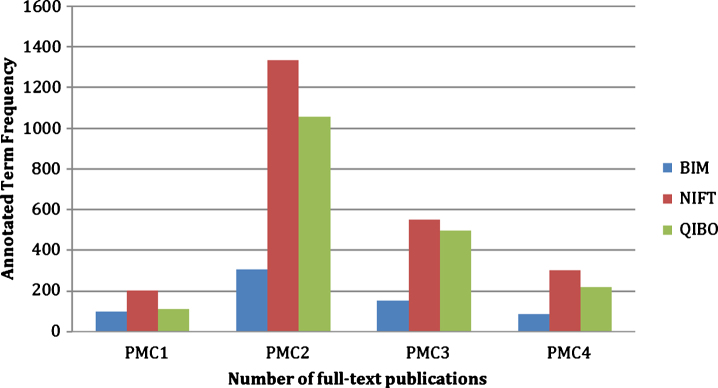
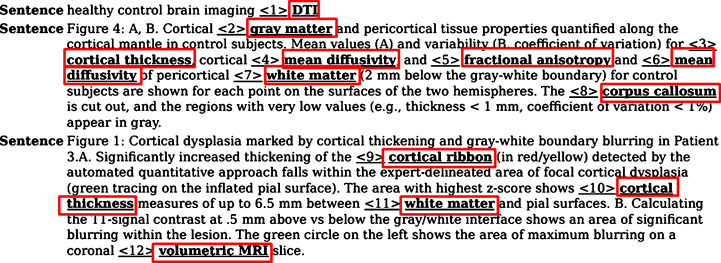
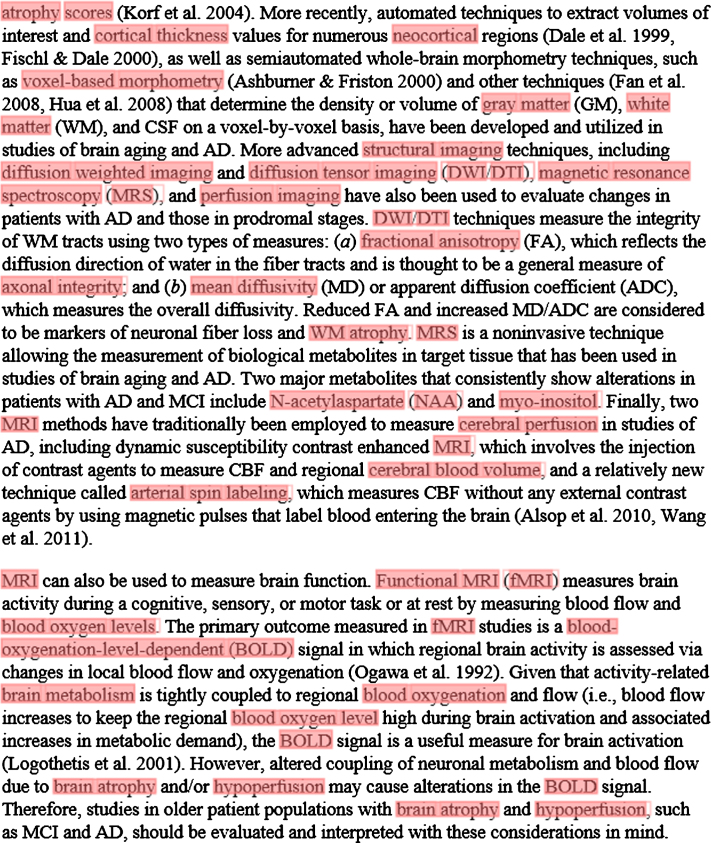
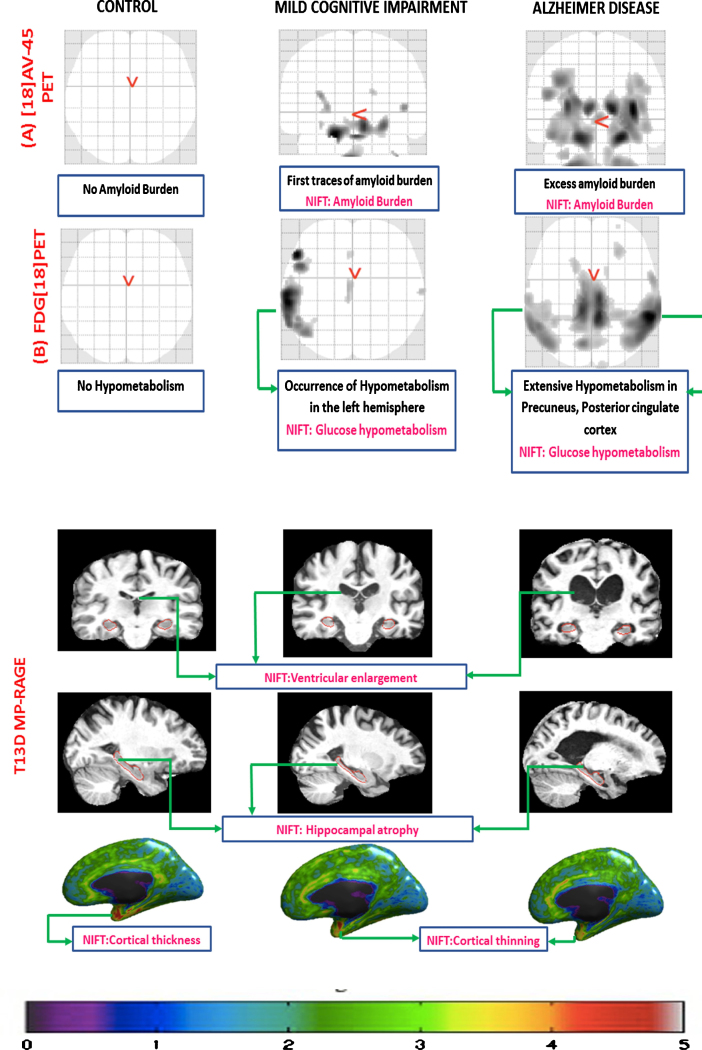
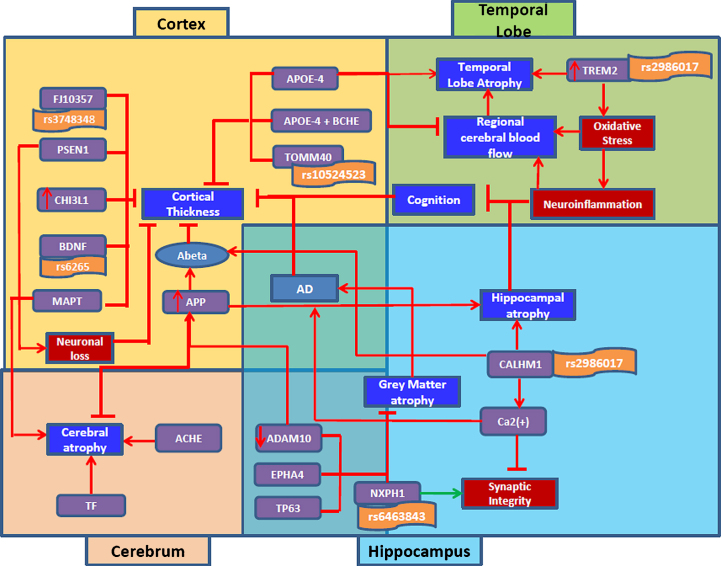
Ontologies and terminologies are used for interoperability of knowledge and data in a standard manner among interdisciplinary research groups. Existing imaging ontologies capture general aspects of the imaging domain as a whole such as methodological concepts or calibrations of imaging instruments. However, none of the existing ontologies covers the diagnostic features measured by imaging technologies in the context of neurodegenerative diseases. Therefore, the Neuro-Imaging Feature Terminology (NIFT) was developed to organize the knowledge domain of measured brain features in association with neurodegenerative diseases by imaging technologies. The purpose is to identify quantitative imaging biomarkers that can be extracted from multi-modal brain imaging data. This terminology attempts to cover measured features and parameters in brain scans relevant to disease progression. In this paper, we demonstrate the systematic retrieval of measured indices from literature and how the extracted knowledge can be further used for disease modeling that integrates neuroimaging features with molecular processes.

Keywords: Alzheimer’s disease; annotation; brain; neuroimaging; terminology.


Figures

Fig.1
Fig.1
Hierarchical structure of NIFT as visualized in the Protégé OWL Editor. This figure depicts the higher level concepts the terminology namely Algorithms, Brain Region, Clinical Indices, Clinical trial information, Imaging Technique, Measured Feature, and Radiopharmaceutical compound.
Fig.2
Fig.2
Cross-validation of NIFT terminology against QIBO and BIM. The figure illustrates the evaluation of NIFT by comparing the term relevancy from NIFT, QIBO, and BIM against four full-text PubMed Central articles (PMC1, PMC2, PMC3, and PMC4).
Fig.3
Fig.3
Annotation of an assembly of figure captions with NIFT terminology. This figure showcases the figure captions extracted from publications using NIFT terminology. The red box indicates the NIFT terms present in the figure captions.
Fig.4
Fig.4
Annotation of a section of a full-text article using the NIFT terminology. The ProMiner tagger was used to identify NIFT terms in full text; matching terms are marked up in red.
Fig.5
Fig.5
Manual annotation of brain image scans using NIFT. This figure represents different biomarkers captured using three different imaging techniques in control, mild cognitive impairment (MCI), and AD respectively. A) [18] AV-45 PET scan: this figure captures the increased amount of amyloid burden (p-value threshold 0.001; voxel extend 10; smoothing kernel [8-8-8]) during the disease progression across CN, MCI, and AD, respectively. B) FDG [18] PET: this figure captures no hypometabolism in control, increased hypometabolic pattern in case of MCI, and extensive hypometabolic topography in the temporo-parietal regions, precuneus, and posterior cingulate cortex (p-value threshold 0.001; voxel extend 10; smoothing kernel [8-8-8]). C) T13D MP-RAGE: the first row of the figure demonstrates the progressive ventricular enlargement among control, MCI, and AD respectively. The second row represents progressive hippocampal atrophy across control, MCI, and AD. The third row represents progressive cortical shrinkage in the temporal-parietal lobe, posterior cingulate and precuneus area.
Fig.6
Fig.6
Integrative view of literature-derived associations between molecular and clinical indices in AD through image-derived features. This figure illustrates the complex interaction of genetic players playing a causative/protective role in underlying disease pathology through neuroimaging indices. Top left part of the figure key genetic factors that play a role in shrinking of the cortex eventually leading to AD; top right part of the figure consists of genes involved in neuro-inflammation and temporal lobe atrophy; Bottom left part of the figure displays genes involved in cerebral atrophy; bottom right part consists of genes playing a role in hippocampal and gray matter atrophy. The red color symbol (-|) indicates perturbation of a gene. The red color arrow indicates the function of a gene in disease condition. The green arrow represents the normal process.

References

    1. Cash DM, Rohrer JD, Ryan NS, Ourselin S, Fox NC (2014) Imaging endpoints for clinical trials in Alzheimer’s disease. Alzheimers Res Ther 6, 87. - PMC - PubMed
    1. Ishii K (2014) PET approaches for diagnosis of dementia. AJNR Am J Neuroradiol 35, 2030–2038. - PMC - PubMed
    1. Younesi E, Hofmann-Apitius M (2013) Biomarker-guided translation of brain imaging into disease pathway models. Sci Rep 3, 3375. - PMC - PubMed
    1. Kassab GS, An G, Sander EA, Miga MI, Guccione JM, Ji S, Vodovotz Y (2016) Augmenting surgery via multi-scale modeling and translational systems biology in the era of precision medicine: A multidisciplinary perspective. Ann Biomed Eng 44, 2611–2625. - PMC - PubMed
    1. De Bono B, Safaei S, Grenon P, Nickerson DP, Alexander S, Helvensteijn M, Kok JN, Kokash N, Wu A, Yu T, Hunter P, Baldock RA (2015) The open physiology workflow: Modeling processes over physiology circuitboards of interoperable tissue units. Front Physiol 6, 24. - PMC - PubMed

LinkOut - more resources