. 2017 Oct;30(10):10.1002/nbm.3767.
doi: 10.1002/nbm.3767. Epub 2017 Jul 21.

Inversion recovery ultrashort echo time imaging of ultrashort T2 tissue components in ovine brain at 3 T: a sequential D2 O exchange study

Affiliations

Inversion recovery ultrashort echo time imaging of ultrashort T2 tissue components in ovine brain at 3 T: a sequential D2 O exchange study

Shu-Juan Fan et al. NMR Biomed. 2017 Oct.

Abstract

Inversion recovery ultrashort echo time (IR-UTE) imaging holds the potential to directly characterize MR signals from ultrashort T2 tissue components (STCs), such as collagen in cartilage and myelin in brain. The application of IR-UTE for myelin imaging has been challenging because of the high water content in brain and the possibility that the ultrashort T2 * signals are contaminated by water protons, including those associated with myelin sheaths. This study investigated such a possibility in an ovine brain D2 O exchange model and explored the potential of IR-UTE imaging for the quantification of ultrashort T2 * signals in both white and gray matter at 3 T. Six specimens were examined before and after sequential immersion in 99.9% D2 O. Long T2 MR signals were measured using a clinical proton density-weighted fast spin echo (PD-FSE) sequence. IR-UTE images were first acquired with different inversion times to determine the optimal inversion time to null the long T2 signals (TInull ). Then, at this TInull , images with echo times (TEs) of 0.01-4 ms were acquired to measure the T2 * values of STCs. The PD-FSE signal dropped to near zero after 24 h of immersion in D2 O. A wide range of TInull values were used at different time points (240-330 ms for white matter and 320-350 ms for gray matter at TR = 1000 ms) because the T1 values of the long T2 tissue components changed significantly. The T2 * values of STCs were 200-300 μs in both white and gray matter (comparable with the values obtained from myelin powder and its mixture with D2 O or H2 O), and showed minimal changes after sequential immersion. The ultrashort T2 * signals seen on IR-UTE images are unlikely to be from water protons as they are exchangeable with deuterons in D2 O. The source is more likely to be myelin itself in white matter, and might also be associated with other membranous structures in gray matter.

Keywords: T2*; gray matter; inversion recovery ultrashort echo time imaging; inversion time; myelin; white matter.


Figures

Figure 1
Figure 1
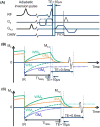
(A) Diagram of the 2D adiabatic inversion recovery ultrashort echo time (IR-UTE) pulse sequence with a minimum nominal TE of 10 μs. (B–C) Expected magnetization changes of WM and GM ultrashort T2 and long T2 components (WMS, GMS, WML and GML), with an inversion time (TI) that is chosen to null the WML, and GML respectively. The adiabatic inversion recovery pulse provides robust inversion of the longitudinal magnetization (Mz) of long T2 components. Mz of the ultrashort T2 components experience significant relaxation on the transverse plane during the long adiabatic inversion process, and are not inverted but partially saturated. At the time when UTE acquisition starts (TE = 10 μs, i.e. TE10μs) and with TI chosen to null WML (Fig. B), GML have negative and GMS have positive magnetization, leading to a smaller magnitude of the GM net magnetization. At a relatively longer TE (e.g. TE = 0.6 ms, i.e. TE0.6ms), the magnitude of GML signal is essentially the same as that at TE10μs, while WMS and GMS signals decay to zero or near zero. Subtraction of the magnitude signals seen in the image acquired at a longer TE from those seen on TE10μs image provides positive contrast for WM and negative contrast for GM, enabling exclusive visualization of WMS. With a TI chosen to null GML (Fig. C), both WML and WMS have positive signals at TE10μs, and the subtraction image provides positive contrast for both WM and GM, with WM generally showing higher signal.
Figure 2
Figure 2
(A) Longitudinal magnetizations (Mz) of WM and GM long T2 components (i.e., WML and GML) plotted against inversion time (TI) in the IR-UTE sequence. (B) 2D IR-UTE images of one cerebral specimen (no. 1) acquired with different TIs before exchange with D2O (TR/TE = 1000/2.2 ms). Note that at TE = 2.2 ms, the signals of WM and GM ultrashort T2 components (WMS and GMS) become negligible due to their ultrashort T2*s. At shorter TIs (TI = 20 ms and 100 ms), there is little or no contrast between WM and GM. With TI increased to 300 ms, WML signals were largely suppressed and GML signals were moderately suppressed, as evidenced by the near zero signals in the WM and dramatic signal reduction in the GM. Further increase in TI resulted in signal increase in both WM and GM, with WM showing higher signal than GM. (C) T1 map calculated from images in Figure (B). The three purple boxes represent three regions of interest (ROIs) defined in the WM for quantification of the average WML T1. (D) T1 fitting curves of a WM ROI (left, red box) and a GM ROI (right, red box) shows that with TR = 1000 ms, the TI for optimal nulling long T2 signals (TInull) was ~300 ms for WML and ~377 ms for GML, respectively.
Figure 3
Figure 3
(A) IR-UTE images from one cerebral specimen (no.1) acquired before exchange with D2O with the inversion time (300 ms) chosen to null WM long T2 components (TR = 1000 ms). T2* values of the WM ultrashort T2 components were 200 to 300 μs as shown on the T2* map (lower panel, right corner). (B) The magnitude subtraction image (TE10μs – TE0.6ms) provides positive signal for WM and negative signal form GM. (C) Mono-exponential fitting of the IR-UTE images in Figure A showed a T2* value of 206 μs in a WM ROI (yellow box, Fig. B).
Figure 4
Figure 4
(A) PD-FSE images of one cerebral hemisphere specimen (no.1) acquired before (0 min) and after sequential immersion in D2O for 90 min, 150 min and 24 hrs. PD signals progressively decreased with increasing immersion time. (B) Corresponding IR-UTE images (TE = 10 μs) of the same specimen acquired with an inversion time that was chosen to null WM long T2 components. (C) Quantitative sequential signal intensity changes of the PD-FSE images in Figure A, as measured in three regions of interests (ROIs) in WM (small yellow boxes inside the tissue area, 0-min PD-FSE and IR-UTE images). (D) Corresponding average T1 changes in these WM ROIs. (E) Relatively constant T2* values were obtained from these ROIs at corresponding time points. Signal-to-noise ratio (SNR) of the PD-FSE image was 166 and 11.3 for a WM ROI (the small yellow box labeled with a red star in the 0-min PD-FSE and IR-UTE images) before and after exchange, respectively. SNR of the corresponding IR-UTE image was 20.5 and 21.4 before and after exchange, respectively (TE = 10 μs). White arrowheads show the margin (sealed by 3M Micropore® surgical tape) of the 2.5-inch plastic dish containing the samples. The margin of the plastic dish was immediately next to the 3-inch surface coil. The ROI representing background noise was placed outside of the coil area (Figs. A&B, the large yellow boxes on the top right corner labeled with red stars).
Figure 5
Figure 5
PD-FSE (TR/TE = 8000/13.5 ms) and UTE (TR/TE = 1000/0.01 ms) images, as well as UTE bi-component T2* fitting results of one cerebral hemisphere specimen (no.5) before (top panel) and after (bottom panel) it was immersed in D2O for 24 hrs. fS stands for fraction of ultrashort T2 components, ST2* stands for T2* of the ultrashort T2 components, and LT2* stands for T2* of the long T2 components. Inserts in the bi-component T2* fitting plots (Fig. C and Fig. F) are IR-UTE images (TR/TE = 1000/0.01 ms) before and after exchange with D2O, with long T2 signals from GM being suppressed by the adiabatic inversion pulse. The red circle in the top insert (Fig. C) shows the definition of the region of interest (ROI) in WM for T2* fitting at both time points.
Figure 6
Figure 6
(A) PD-FSE image of the cerebellar specimen before exchange with D2O. (B) Selected IR-UTE images of the same specimen before exchange acquired at TR = 1000 ms with two different TIs and variable TEs. At TI = 260 ms (top panel), the magnitude subtraction image (TE10μs – TE0.6ms) highlights WM ultrashort T2 components (WMS). At TI = 350 ms, the subtraction image highlights both WMS and GM ultrashort T2 components, with WMS showing higher signal. (C) T2* fitting curves in a WM region of interest (ROI) (TI = 260 ms, red box) and a GM ROI (TI = 350 ms, yellow circle). (D) Sequential changes of average PD-FSE signal intensity, T1s of WM and GM long T2 components, and T2*s of WM and GM ultrashort T2 components in the defined ROIs in Figure C after immersion in D2O. White arrowheads show the margin (sealed by 3M Micropore® surgical tape) of the 2.5-inch plastic dish containing the samples.

Similar articles

Cited by

References

    1. Laule C, Vavasour IM, Kolind SH, Li DK, Traboulsee TL, Moore GR, MacKay AL. Magnetic resonance imaging of myelin. Neurotherapeutics. 2007;4(3):460–484. - PMC - PubMed
    1. Wilhelm MJ, Ong HH, Wehrli SL, Li C, Tsai PH, Hackney DB, Wehrli FW. Direct magnetic resonance detection of myelin and prospects for quantitative imaging of myelin density. P Natl Acad Sci USA. 2012;109(24):9605–9610. - PMC - PubMed
    1. Koch-Henriksen N, Sorensen PS. The changing demographic pattern of multiple sclerosis epidemiology. Lancet Neurol. 2010;9(5):520–532. - PubMed
    1. Horch RA, Gore JC, Does MD. Origins of the ultrashort-T2 1H NMR signals in myelinated nerve: a direct measure of myelin content? Magn Reson Med. 2011;66(1):24–31. - PMC - PubMed
    1. Deoni SCL, Rutt BK, Arun T, Pierpaoli C, Jones DK. Gleaning Multicomponent T(1) and T(2) Information From Steady-State Imaging Data. Magn Reson Med. 2008;60(6):1372–1387. - PubMed