

Inferring microbial interactions in thermophilic and mesophilic anaerobic digestion of hog waste
- PMID: 28732056
- PMCID: PMC5521784
- DOI: 10.1371/journal.pone.0181395
Inferring microbial interactions in thermophilic and mesophilic anaerobic digestion of hog waste
Abstract
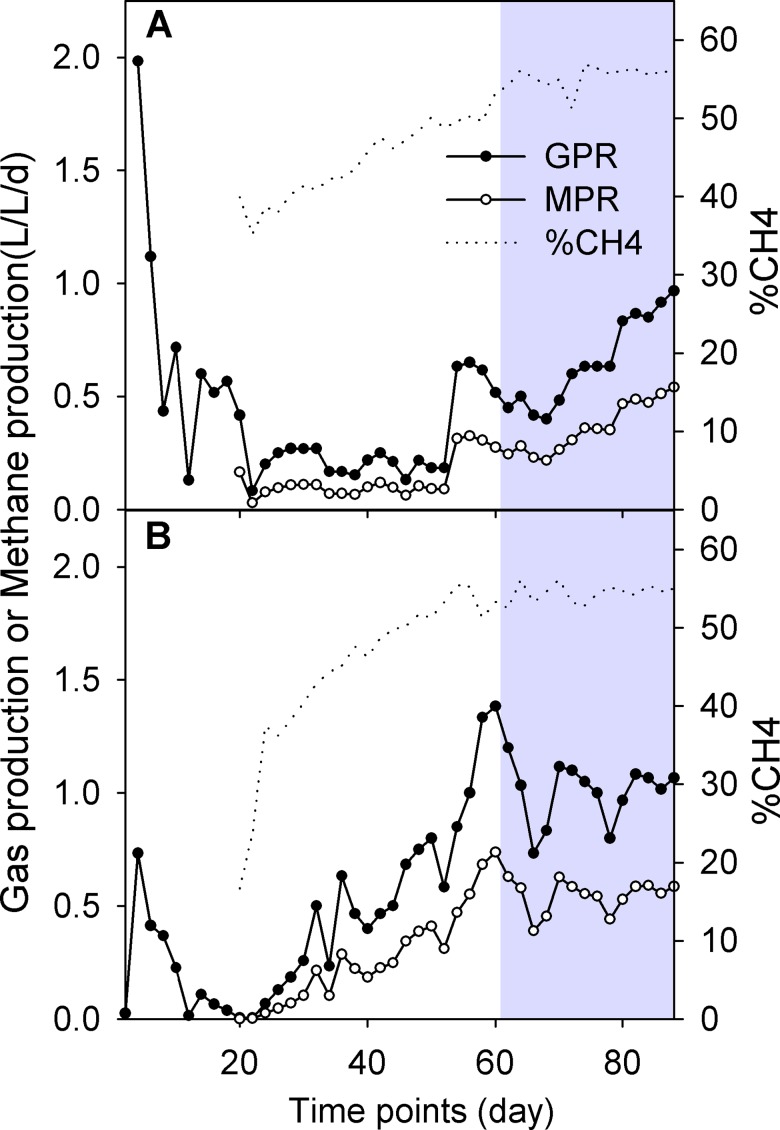
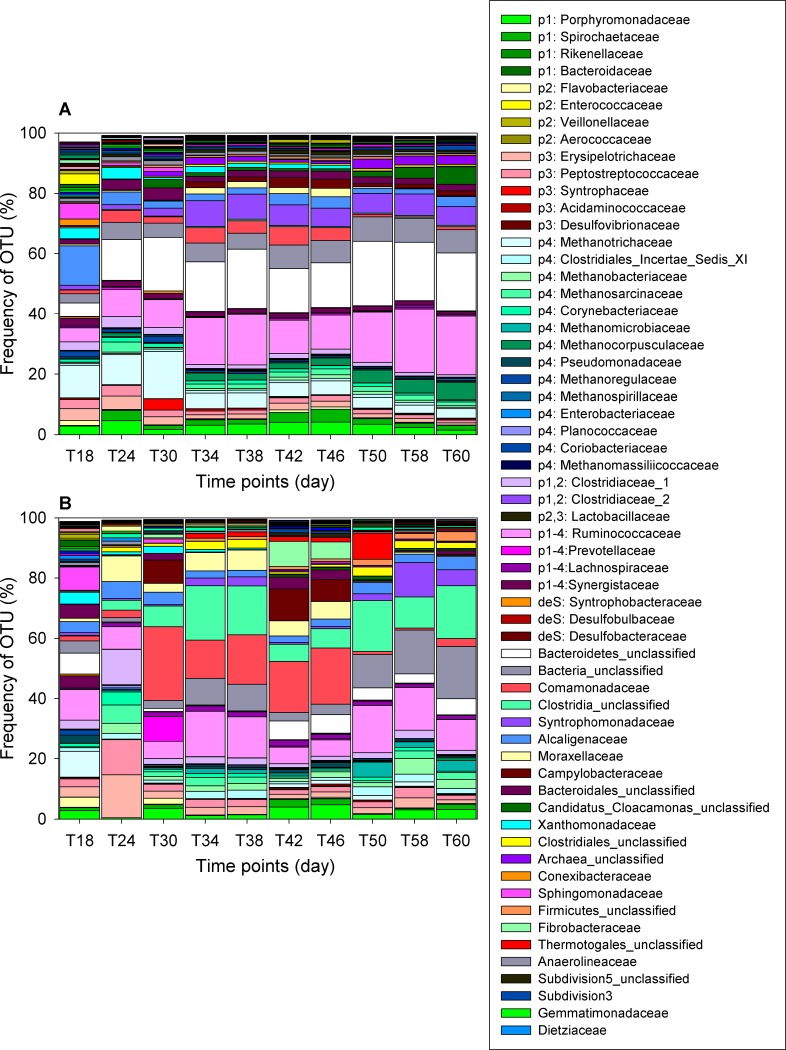
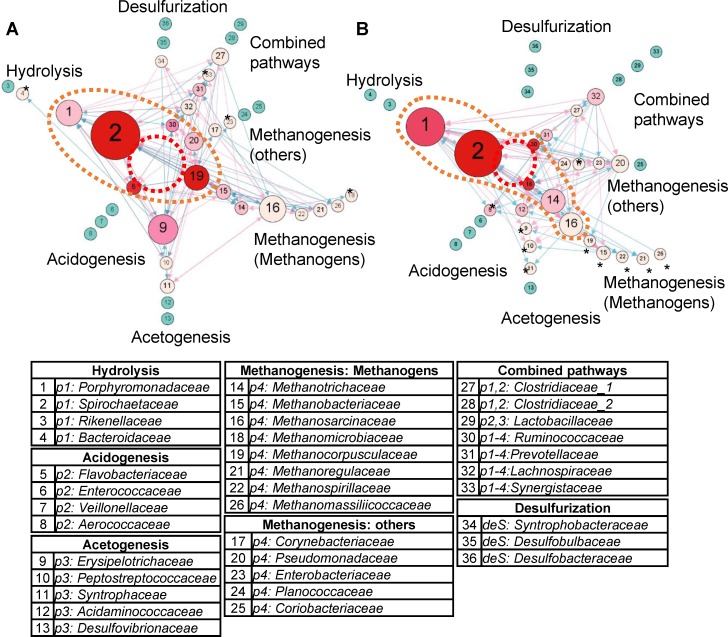
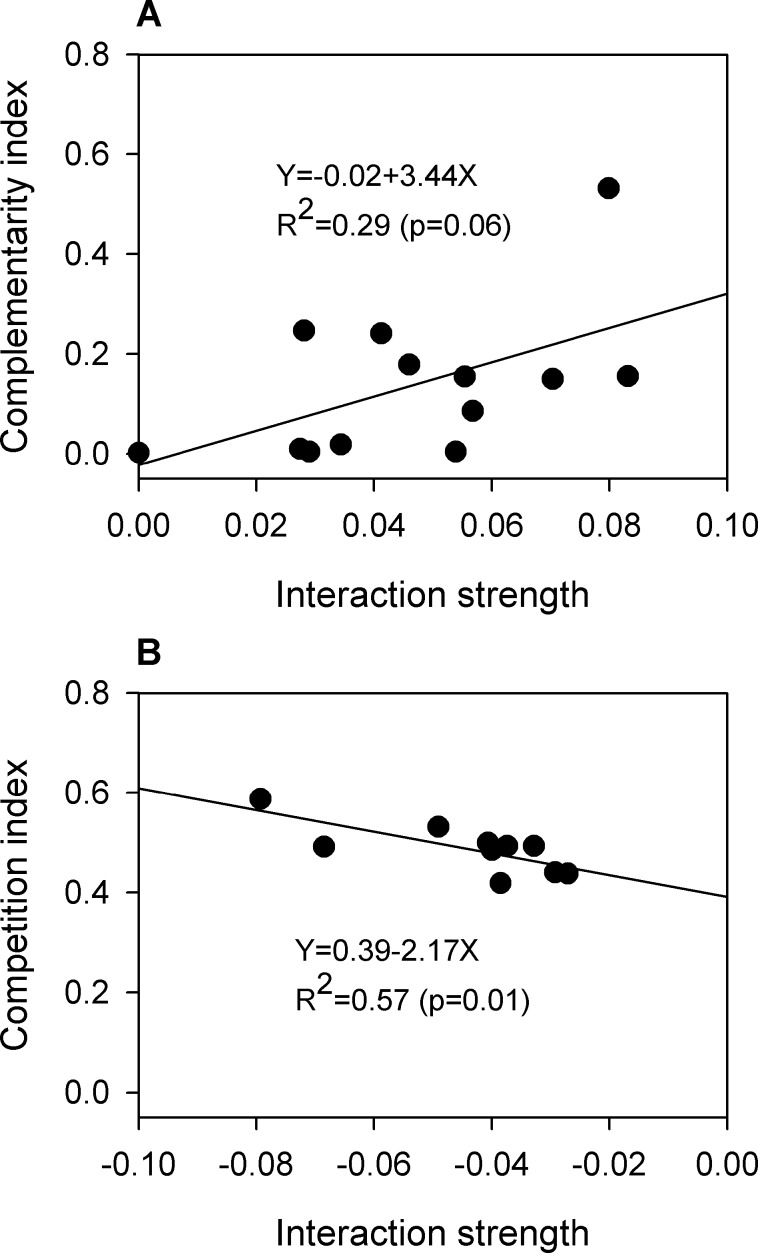
Anaerobic digestion (AnD) is a microbiological process that converts organic waste materials into biogas. Because of its high methane content, biogas is a combustible energy source and serves as an important environmental technology commonly used in the management of animal waste generated on large animal farms. Much work has been done on hardware design and process engineering for the generation of biogas. However, little is known about the complexity of the microbiology in this process. In particular, how microbes interact in the digester and eventually breakdown and convert organic matter into biogas is still regarded as a "black box." We used 16S rRNA sequencing as a tool to study the microbial community in laboratory hog waste digesters under tightly controlled conditions, and systematically unraveled the distinct interaction networks of two microbial communities from mesophilic (MAnD) and thermophilic anaerobic digestion (TAnD). Under thermophilic conditions, the well-known association between hydrogen-producing bacteria, e.g., Ruminococcaceae and Prevotellaceae, and hydrotrophic methanogens, Methanomicrobiaceae, was reverse engineered by their interactive topological niches. The inferred interaction network provides a sketch enabling the determination of microbial interactive relationships that conventional strategy of finding differential taxa was hard to achieve. This research is still in its infancy, but it can help to depict the dynamics of microbial ecosystems and to lay the groundwork for understanding how microorganisms cohabit in the anaerobic digester.
Conflict of interest statement
Figures

References
-
- Tour JM, Kittrell C, Colvin VL. Green carbon as a bridge to renewable energy. Nature materials. 2010;9(11):871–4. Epub 2010/10/23. doi: 10.1038/nmat2887 . - DOI - PubMed
-
- Weiland P. Production and energetic use of biogas from energy crops and wastes in Germany. Applied Biochemistry and Biotechnology. 2003;109(1–3):263–74. - PubMed
-
- Sreekrishnan T, Kohli S, Rana V. Enhancement of biogas production from solid substrates using different techniques––a review. Bioresource technology. 2004;95(1):1–10. doi: 10.1016/j.biortech.2004.02.010 - DOI - PubMed
-
- Börjesson P, Mattiasson B. Biogas as a resource-efficient vehicle fuel. Trends in biotechnology. 2008;26(1):7–13. doi: 10.1016/j.tibtech.2007.09.007 - DOI - PubMed
-
- Shih JC. Development of Anaerobic Digestion of Animal Waste: From Laboratory, Research and Commercial Farms to a Value-Added New Product Anaerobic Biotechnology: Environmental Protection and Resource Recovery: World Scientific; 2015. p. 339–52.
MeSH terms
Substances
LinkOut - more resources
Full Text Sources
Other Literature Sources
