. 2017 Jul 21;12(7):e0181726.
doi: 10.1371/journal.pone.0181726. eCollection 2017.

Increased ParB level affects expression of stress response, adaptation and virulence operons and potentiates repression of promoters adjacent to the high affinity binding sites parS3 and parS4 in Pseudomonas aeruginosa

Affiliations

Increased ParB level affects expression of stress response, adaptation and virulence operons and potentiates repression of promoters adjacent to the high affinity binding sites parS3 and parS4 in Pseudomonas aeruginosa

Adam Kawalek et al. PLoS One. .

Abstract

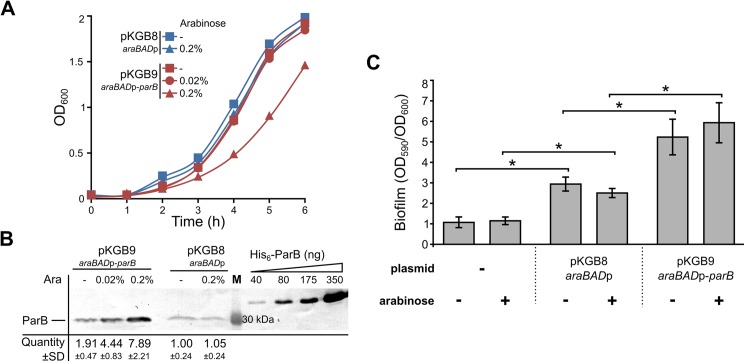
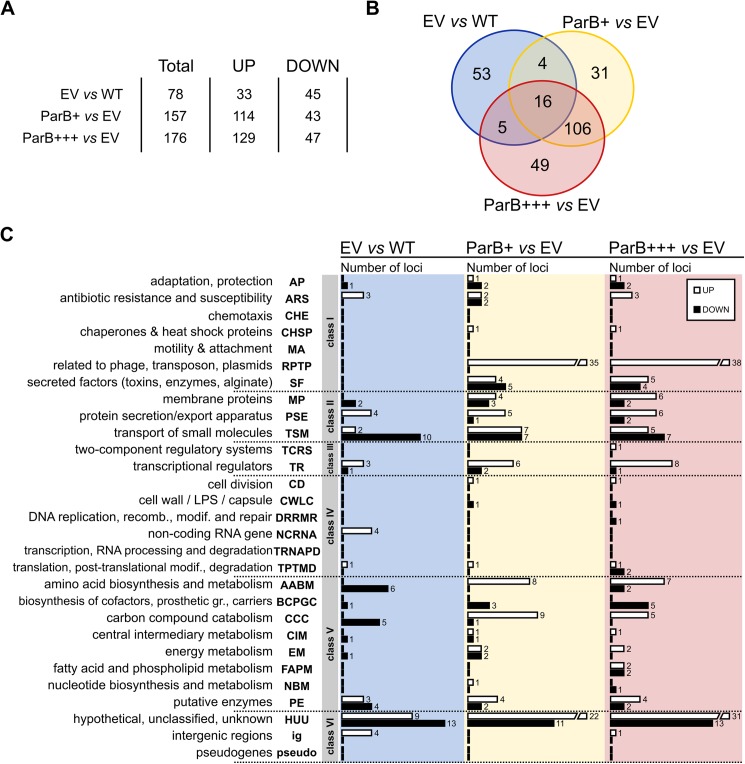
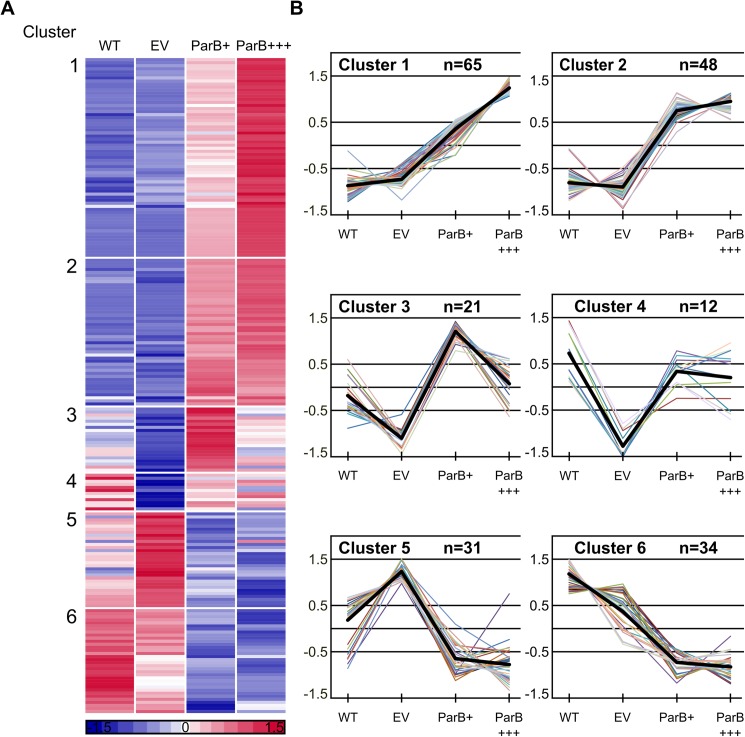
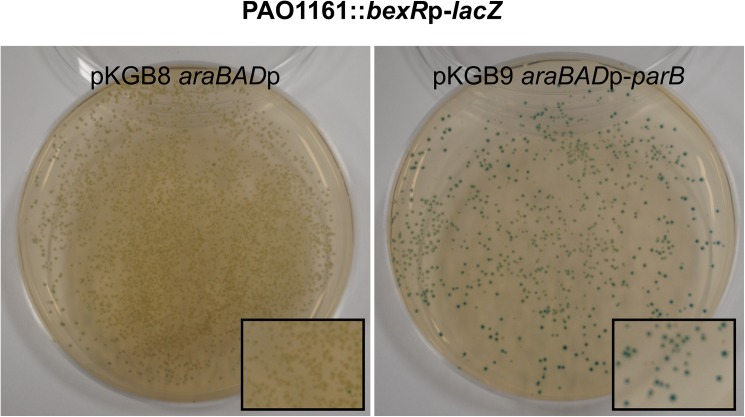
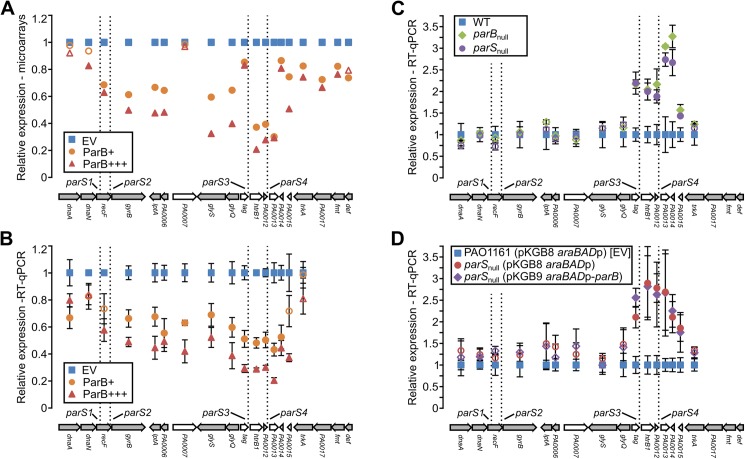
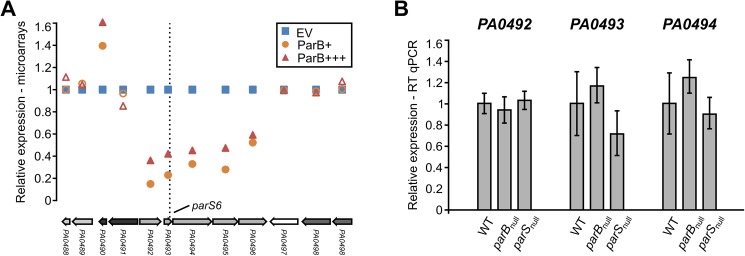
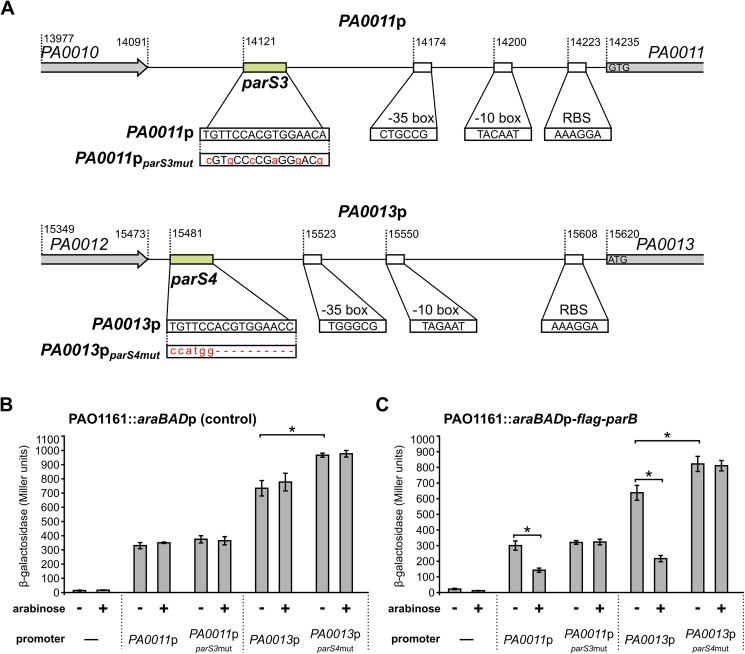
Similarly to its homologs in other bacteria, Pseudomonas aeruginosa partitioning protein ParB facilitates segregation of newly replicated chromosomes. Lack of ParB is not lethal but results in increased frequency of anucleate cells production, longer division time, cell elongation, altered colony morphology and defective swarming and swimming motility. Unlike in other bacteria, inactivation of parB leads to major changes of the transcriptome, suggesting that, directly or indirectly, ParB plays a role in regulation of gene expression in this organism. ParB overproduction affects growth rate, cell division and motility in a similar way as ParB deficiency. To identify primary ParB targets, here we analysed the impact of a slight increase in ParB level on P. aeruginosa transcriptome. ParB excess, which does not cause changes in growth rate and chromosome segregation, significantly alters the expression of 176 loci. Most notably, the mRNA level of genes adjacent to high affinity ParB binding sites parS1-4 close to oriC is reduced. Conversely, in cells lacking either parB or functional parS sequences the orfs adjacent to parS3 and parS4 are upregulated, indicating that direct ParB- parS3/parS4 interactions repress the transcription in this region. In addition, increased ParB level brings about repression or activation of numerous genes including several transcriptional regulators involved in SOS response, virulence and adaptation. Overall, our data support the role of partitioning protein ParB as a transcriptional regulator in Pseudomonas aeruginosa.


Conflict of interest statement

Competing Interests: The authors have declared that no competing interests exist.

Figures

Fig 1
Fig 1. Effects of ParB excess in P. aeruginosa.
(A) Growth of P. aeruginosa PAO1161 (pKGB8 araBADp) and PAO1161 (pKGB9 araBADp-parB) strains in L broth with different arabinose concentrations. Data represent mean OD600. (B) Western blot analysis of ParB levels in the tested strains. Each lane contains extract from 109 cells. Blots were subjected to immunodetection using primary anti-ParB antibodies. Representative blot is shown. Signals on the blots were quantified. Data represent mean ParB level ±SD relatively to the control strain PAO1161 (pKGB8). Purified His6-ParB was used to generate standard curves. M–molecular weight marker. (C) Biofilm formation in the static cultures of PAO1161, PAO1161 (pKGB8) and PAO1161 (pKGB9). Strains were grown without or with 0.02% arabinose until OD600 0.5. Biofilm was stained with crystal violet and assessed by measurement of OD590. Data represent mean OD590/OD600 ratio ±SD from 3 biological replicates. *—p-value < 0.05 in two-sided Student’s t-test assuming equal variance.
Fig 2
Fig 2. Transcriptome changes in response to ParB overproduction.
(A) Statistics of loci with significant expression change (FC<-2 or >2, p-value <0.05). RNA was isolated from PAO1161 cultures grown in L broth without Ara (WT), PAO1161 (pKGB8 araBADp) cultures grown under selection in L broth with 0.02% Ara (empty vector control, EV), PAO1161 (pKGB9 araBADp-parB) cultures grown under selection in L broth without Ara (mild ParB excess, ParB+) or with 0.02% Ara (higher ParB excess, ParB+++). (B) Venn diagram for sets of loci with significant expression change between EV vs WT, ParB+ vs EV and ParB+++ vs EV. (C) Classification of loci with altered expression according to PseudoCAP categories [57]. When a gene was assigned to multiple categories, one category was arbitrarily selected (S2 Table). The PseudoCAP categories were grouped into six classes as marked. White and black bars correspond to the numbers of respectively, upregulated and downregulated genes in a particular category.
Fig 3
Fig 3. K-means clustering of microarray data.
Expression data for replicates for each of 211 loci displaying altered expression in ParB overproducing cells were averaged, normalized to zero mean and unit variance and grouped into six clusters. (A) Expression profiles of individual genes grouped according to the results of K-means clustering. Each horizontal line represents one gene. Red and blue denote that the expression is respectively, above or below the mean expression of a gene across the data set. (B) Expression profiles for genes in each cluster. Y-axis represents the difference between expression of a particular gene in tested conditions and the mean expression of this gene in all 4 conditions presented as the number of standard deviations that a particular data point differs from the mean. Thick black lines represent the cluster centres. The genes from each cluster and their expression levels in different cells are listed in S3 Table.
Fig 4
Fig 4. ParB excess induces the expression of chromosomal bexRp-lacZ transcriptional fusion.
PAO1161::bexRp-lacZ strain contains bexRp-lacZ transcriptional fusion inserted in the intergenic region of PAO1161 genome. White colony from L agar with X-gal was inoculated and used as a recipient in conjugation with either S17-1 (pKGB8) or S17-1 (pKGB9 araBADp-parB) donor cells. Conjugants were grown on selective L agar plates supplemented with X-gal. The photographs show representative plates of PAO1161::bexRp-lacZ with both plasmids.
Fig 5
Fig 5. Influence of ParB on gene expression in the parS1-4 region.
(A) Mean level of expression of dnaA-def (PA0001-PA0019) genes in ParB+ and ParB+++ cells relative to EV as revealed by microarray analysis. Filled markers indicate statistically different expression relative to EV (p-value < 0.05 in ANOVA test). Arrangement of the genes in the chromosome is shown below. Operons (according to the DOOR 2.0 database [73]) are marked in grey. (B) Expression of PA0001-PA0016 (dnaAtrkA) genes in ParB+ and ParB+++ cells relative to EV cells. (C) RT-qPCR analysis of expression of dnaAtrkA genes in parBnull and parSnull strains relative to WT cells. Cells were grown in L broth. (D) RT-qPCR analysis of expression of dnaAtrkA genes in parSnull (pKGB9 araBADp-parB) and parSnull (pKGB8 araBADp) relative to EV [PAO1161 (pKGB8 araBADp)]. Cells were grown in L broth supplemented with chloramphenicol and 0.02% arabinose. RT-qPCR data represent mean ±SD from three biological replicates. Filled symbols indicate significantly different expression (p-value <0.05 in two-sided Student’s t-test assuming equal variance) relative to the control cells labelled as blue squares. The differences in expression of genes in parSnull (pKGB9) strain relative to parSnull (pKGB8) strain are not statistically significant.
Fig 6
Fig 6. Influence of ParB level on expression of genes adjacent to parS6.
(A) Mean level of expression of PA0488PA0498 genes in ParB+ and ParB+++ cells relative to EV cells (microarray data). Filled markers indicate statistically different expression relative to EV (p-value < 0.05 in ANOVA test). Operons (according to the DOOR 2.0 database [73]) are labelled with different shades of grey. (B) RT-qPCR analysis of expression of PA0492, PA0493 and PA0494 genes in parBnull and parSnull strains relative to WT cells. Data represent mean ±SD from three biological replicates. The differences between strains / conditions are not statistically significant (p-value > 0.05 in two-sided Student’s t-test assuming equal variance).
Fig 7
Fig 7. Influence of ParB on the activities of PA0011 and PA0013 promoters.
(A) DNA sequences preceding PA0011 (PA0011p) and PA0013 (PA0013p) and their mutated versions, PA0011pparS3mut and PA0013pparS4mut, cloned upstream of promoter-less lacZ cassette in pPJB132 are presented. Putative promoters’ motifs, RBS sequences and start codons are indicated. Promoter -35 and -10 boxes were predicted using BPROM [74]. β-galactosidase activity was measured in extracts from PAO1161::araBADp (control strain) (B) and PAO1161::araBADp-flag-parB (ParB-overproducing strain) (C) cells carrying pPJB132 derivatives as indicated. Data represent mean activity from at least three cultures ±SD. *—p-value < 0.05 in two-sided Student’s t-test assuming equal variance.

References

    1. Salje J. Plasmid segregation: how to survive as an extra piece of DNA. Crit Rev Biochem Mol Biol. 2010;45: 296–317. doi: 10.3109/10409238.2010.494657 - DOI - PubMed
    1. Baxter JC, Funnell BE. Plasmid partition mechanisms. Microbiol Spectr. 2014;2 doi: 10.1128/microbiolspec.PLAS-0023-2014 - DOI - PubMed
    1. Gerdes K, Howard M, Szardenings F. Pushing and pulling in prokaryotic DNA segregation. Cell. 2010;141: 927–942. doi: 10.1016/j.cell.2010.05.033 - DOI - PubMed
    1. Gerdes K, Møller-Jensen J, Jensen RB. Plasmid and chromosome partitioning: surprises from phylogeny. Mol Microbiol. 2000;37: 455–466. doi: 10.1046/j.1365-2958.2000.01975.x - DOI - PubMed
    1. Funnell BE. ParB partition proteins: complex formation and spreading at bacterial and plasmid centromeres. Mol Recognit. 2016; 44 doi: 10.3389/fmolb.2016.00044 - DOI - PMC - PubMed

MeSH terms

Substances