. 2017 Aug;19(8):649-658.
doi: 10.1016/j.neo.2017.05.002. Epub 2017 Jul 18.

UALCAN: A Portal for Facilitating Tumor Subgroup Gene Expression and Survival Analyses

Affiliations

UALCAN: A Portal for Facilitating Tumor Subgroup Gene Expression and Survival Analyses

Darshan S Chandrashekar et al. Neoplasia. 2017 Aug.

Abstract

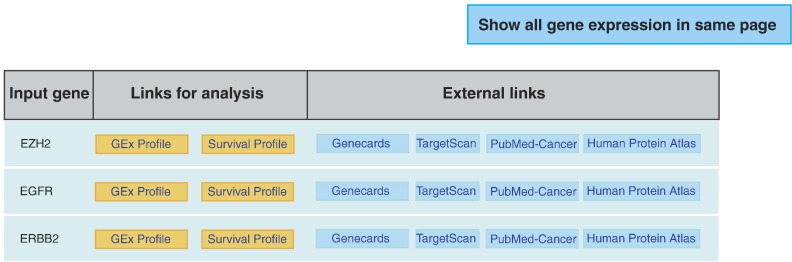
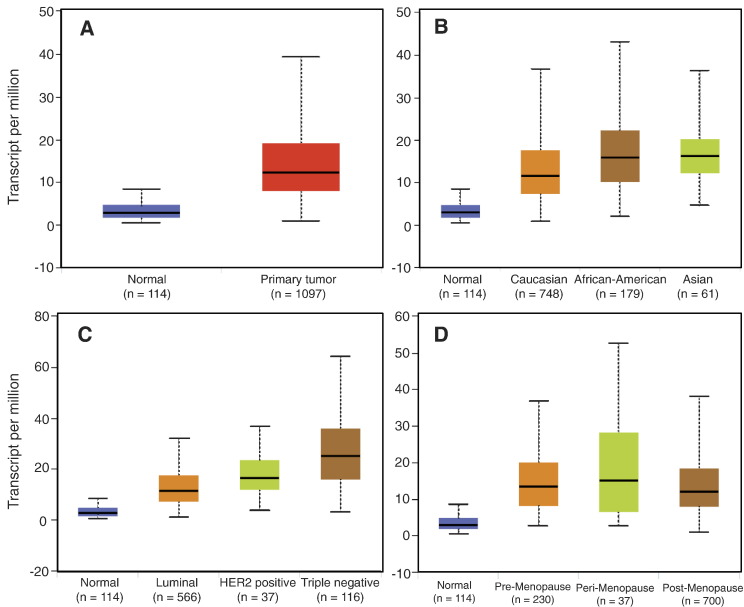
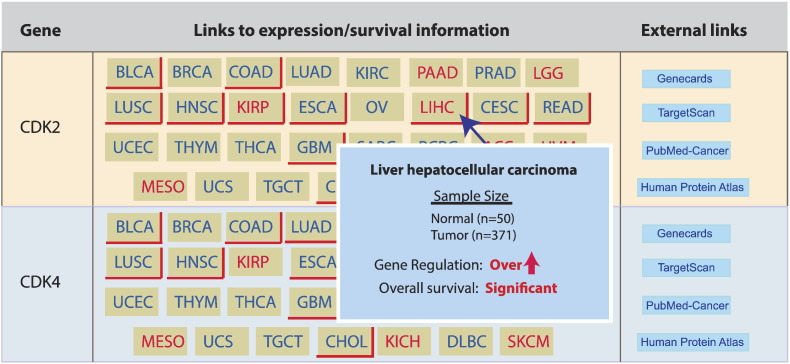
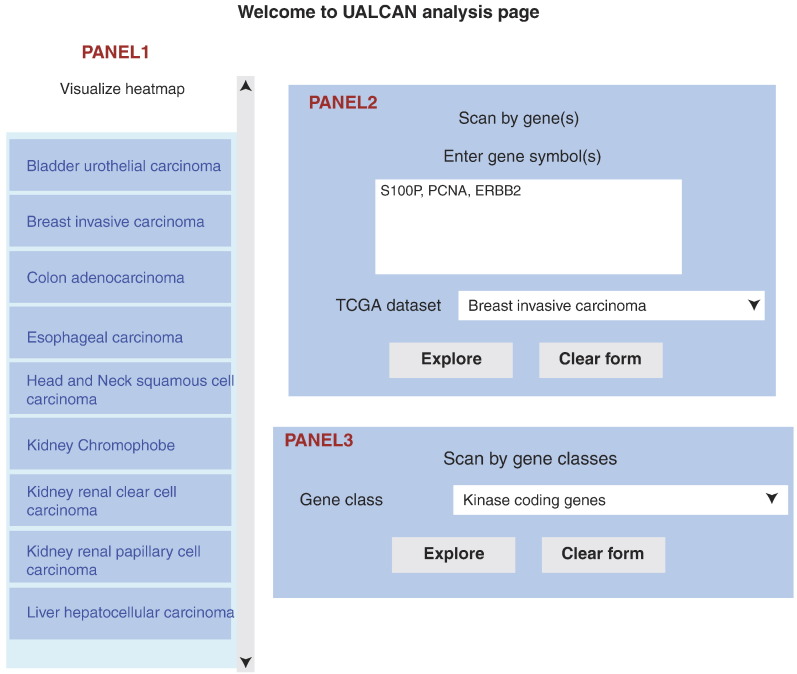
Genomics data from The Cancer Genome Atlas (TCGA) project has led to the comprehensive molecular characterization of multiple cancer types. The large sample numbers in TCGA offer an excellent opportunity to address questions associated with tumo heterogeneity. Exploration of the data by cancer researchers and clinicians is imperative to unearth novel therapeutic/diagnostic biomarkers. Various computational tools have been developed to aid researchers in carrying out specific TCGA data analyses; however there is need for resources to facilitate the study of gene expression variations and survival associations across tumors. Here, we report UALCAN, an easy to use, interactive web-portal to perform to in-depth analyses of TCGA gene expression data. UALCAN uses TCGA level 3 RNA-seq and clinical data from 31 cancer types. The portal's user-friendly features allow to perform: 1) analyze relative expression of a query gene(s) across tumor and normal samples, as well as in various tumor sub-groups based on individual cancer stages, tumor grade, race, body weight or other clinicopathologic features, 2) estimate the effect of gene expression level and clinicopathologic features on patient survival; and 3) identify the top over- and under-expressed (up and down-regulated) genes in individual cancer types. This resource serves as a platform for in silico validation of target genes and for identifying tumor sub-group specific candidate biomarkers. Thus, UALCAN web-portal could be extremely helpful in accelerating cancer research. UALCAN is publicly available at http://ualcan.path.uab.edu.


Figures

Figure 3
Figure 3
UALCAN output page listing genes queried, along with links to analyze their expression and survival associations in cancer types of interest. Links to GeneCards, TargetScan, PubMed and Human Protein Atlas are also provided through the interface.
Figure 4
Figure 4
Box-whisker plots showing the expression of EZH2 in sub groups of breast invasive carcinoma samples (BRCA). (A) Boxplot showing relative expression of EZH2 in normal and BRCA samples. (B) Boxplot showing relative expression of EZH2 in normal, African American, Caucasian and Asian BRCA patients. (C) Boxplot showing relative expression of EZH2 in normal, luminal, HER2 positive and triple negative BRCA patients. (D) Boxplot showing relative expression of EZH2 in normal, pre-menopause, peri-menopause and post-menopause patients.
Figure 5
Figure 5
Kaplan–Meier plots showing the association of EZH2 expression and other clinical parameters with patient survival. (A) KM plot depicting association of EZH2 expression levels with patient survival. (B) KM plot depicting association of EZH2 expression levels and race with patient survival. (C) KM plot depicting association of EZH2 expression level and BRCA subtype with patient survival. (D) KM plot depicting association of EZH2 expression levels and menopause status with patient survival.
Figure 6
Figure 6
Snapshot of UALCAN output page showing differential expression status and survival impact across 31 cancer types of genes involved in P53 signaling pathway. In the interface, a pop up text appears on placing the cursor over the buttons showing summary, while the user can access expression and survival information for a given gene by clicking the corresponding button.
Figure 1
Figure 1
Snapshot of UALCAN analysis page. The left side panel shows a list of cancer types, each type being hyperlinked to a web page showing the top over- or under-expressed genes in tumor compared to normal samples. The top-right side panel allows the user to query UALCAN by official gene symbol(s) and cancer type of interest, while the bottom-right side panel allows the user to query UALCAN using precompiled gene-sets.
Figure 2
Figure 2
Heatmaps showing top differentially expressed genes in breast invasive carcinoma (BRCA). (A) The top 25 over-expressed and (B) the top 25 under-expressed genes in BRCA compared to normal samples. Expression level of gene is represented as log2(TPM+ 1). Sample names and associated expression value can be visualized by placing the cursor over the heatmap.

Similar articles

Cited by

References

    1. Sheehan KM, Calvert VS, Kay EW, Lu Y, Fishman D, Espina V, Aquino J, Speer R, Araujo R, Mills GB. Use of reverse phase protein microarrays and reference standard development for molecular network analysis of metastatic ovarian carcinoma. Mol Cell Proteomics. 2005;4(4):346–355. - PubMed
    1. Trevino V, Falciani F, Barrera-Saldana HA. DNA microarrays: a powerful genomic tool for biomedical and clinical research. Mol Med. 2007;13(9–10):527–541. - PMC - PubMed
    1. Reuter JA, Spacek DV, Snyder MP. High-throughput sequencing technologies. Mol Cell. 2015;58(4):586–597. - PMC - PubMed
    1. Tomczak K, Czerwinska P, Wiznerowicz M. The Cancer Genome Atlas (TCGA): an immeasurable source of knowledge. Contemp Oncol (Pozn) 2015;19(1A):A68–A77. - PMC - PubMed
    1. Cancer Genome Atlas Research N Comprehensive genomic characterization defines human glioblastoma genes and core pathways. Nature. 2008;455(7216):1061–1068. - PMC - PubMed