. 2017 Sep 4;216(9):2645-2655.
doi: 10.1083/jcb.201608084. Epub 2017 Jul 21.

CENP-A and topoisomerase-II antagonistically affect chromosome length

Affiliations

CENP-A and topoisomerase-II antagonistically affect chromosome length

A-M Ladouceur et al. J Cell Biol. .

Abstract

The size of mitotic chromosomes is coordinated with cell size in a manner dependent on nuclear trafficking. In this study, we conducted an RNA interference screen of the Caenorhabditis elegans nucleome in a strain carrying an exceptionally long chromosome and identified the centromere-specific histone H3 variant CENP-A and the DNA decatenizing enzyme topoisomerase-II (topo-II) as candidate modulators of chromosome size. In the holocentric organism C. elegans, CENP-A is positioned periodically along the entire length of chromosomes, and in mitosis, these genomic regions come together linearly to form the base of kinetochores. We show that CENP-A protein levels decreased through development coinciding with chromosome-size scaling. Partial loss of CENP-A protein resulted in shorter mitotic chromosomes, consistent with a role in setting chromosome length. Conversely, topo-II levels were unchanged through early development, and partial topo-II depletion led to longer chromosomes. Topo-II localized to the perimeter of mitotic chromosomes, excluded from the centromere regions, and depletion of topo-II did not change CENP-A levels. We propose that self-assembly of centromeric chromatin into an extended linear array promotes elongation of the chromosome, whereas topo-II promotes chromosome-length shortening.


Figures

Figure 1.
Figure 1.
RNAi screen of the C. elegans nucleome identifies chromosomal architecture proteins as regulators of chromosome size. (a) Diagrammatic flow and list of positive hits from the RNAi screen. Pink asterisks highlight potential regulators of chromosome length tested in this study. zts, zygotes. (b) Representative images of five different phenotypes and partial CENP-A RNAi observed after RNAi treatment of wild-type or long-chromosome strains.
Figure 2.
Figure 2.
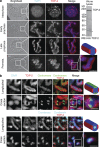
Endogenous topo-II forms axes distinct from the centromere and the condensin complex. (a) One-cell embryos fixed and stained with anti–topo-II antibody and DAPI, at different mitotic stages. The insets show zoomed-in images of a single prometaphase (Prometa.) chromosome. Anti–topo-II antibody probing the whole-worm lysate by Western blotting (WB) is shown. The asterisk indicates a band that is unaffected by top-2 RNAi. (b) Centromeres marked with GFP–KNL-2 (OD31) or GFP-condensin (GFP–CAPG-2 and OD112) expressing single-cell embryos immunostained with anti–topo-II antibody to compare centromere and condensin with topo-II localization. The montage shows longitudinal views of a single prometaphase chromosome (first and third rows) and cross-sectional views of a chromosome (second and last rows). Insets show a zoomed-in cross-sectional view of a single chromosome. Schematics of a single prometaphase chromosome show a 3D view of spatial organization of topo-II (red), centromere (green), condensin (light blue), and DNA (dark blue). Bars: (fluorescence images) 1 µm; (brightfield images) 5 µm.
Figure 3.
Figure 3.
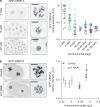
CENP-A and topo-II work antagonistically to set chromosome size. (a) Representative images of single-cell embryos expressing H2B::mCherry and GFP::CENP-A (strain OD421; Fig. S2; Gassmann et al., 2012) and measurements of GFP::CENP-A intensity frequency distribution in control (black circle; n = 16), CENP-A RNAi (dark green triangles; n = 17), partial CENP-A RNAi (aqua squares; n = 23), topo-II RNAi (purple diamonds; n = 8), topo-II + partial CENP-A RNAi (pink stars; n = 3), rcc-1 (open purple circle; n = 8), or rcc1 + partial CENP-A RNAi (open blue squares; n = 7) conditions. Asterisks denote statistically different pairwise comparisons (see Table 2 for details). (b) Representative images of TH32 (animals of normal karyotype [six haploid chromosomes]) single-cell embryos containing GFP::histone-H2B (to visualize chromosomes) and GFP::γ-tubulin (centrosomes; to monitor mitotic progression) and frequency distribution of chromosome length measurements after control (black circles; n = 89), partial CENP-A RNAi (aqua squares; n = 84), topo-II RNAi (purple diamonds; n = 75), or topo-II + partial CENP-A RNAi (pink stars; n = 71). Ana., anaphase; Meta, metaphase; Prometa., prometaphase. Conditions are significantly different by one-way ANOVA. Error bars represent 95% confidence interval. Bars, 5 µm.
Figure 4.
Figure 4.
Chromatin-associated CENP-A levels decrease during development and are regulated by nuclear import. (a) Representative images of embryos expressing GFP::CENP-A at three different developmental stages and frequency distribution of relative intensity measurements of chromatin GFP::CENP-A during development, from the 2- to 100-cell stage. Relative intensity measurements of chromatin GFP::CENP-A during development are different by one-way ANOVA. n =14 (2 cells), 18 (4 cells), 28 (8 cells), 12 (16 cells), 18 (30–49 cells), 24 (50–69 cells), and 9 (70–100 cells). Error bars represent mean and 95% confidence interval. (b) Representative images of two cell–stage embryos expressing GFP::CENP-A (OD421) after RNAi depletion of control (black circles; n = 72) or rcc-1 RNAi (purple circles; n = 68). Mean GFP::CENP-A relative intensities according to chromosome length are graphed (mean chromosome length measurements at 2-, 4-, 8-, and 16-cell stages taken from Ladouceur et al., 2015. Control conditions are different by one-way ANOVA (P < 0.001), and rcc1 RNAi conditions are not different by one-way ANOVA (P = 0.14). Bars, 5 µm.
Figure 5.
Figure 5.
The amount of CENP-A incorporated into existing centromere domains sets the chromosome length. (a) Representative images of single-cell embryos expressing GFP::CENP-A and H2B::mCherry after control or CSR-1 RNAi. (b) GFP::CENP-A sum intensity for each individual segmented chromosome in relation to chromosome length and chromosome length for individual segmented chromosomes after control and csr-1 RNAi. Each slope is statistically different from zero. The slopes of the linear regression of the two conditions are statistically different. P < 0.01. (c) GFP::CENP-A maximum voxel intensity of individual chromosomes after control and CSR-1 RNAi. (b and c) All intensity values are relative to the maximum intensity of controls. Control (black circles), n = 104; and csr-1 RNAi (purple stars), n = 94 chromosomes measured in >10 embryos. (d) Representative SIM images of chromatin squashes of a single-cell GFP::CENP-A embryo after control RNAi. The arrow points to a representative focus measured in e. (e) Distribution plot of full-width at half-maximum intensity of individual GFP::CENP-A foci measured on images as in d for control (black; n = 21) and csr-1 RNAi (purple; n = 18). Box plots were generated with the application found on http://boxplot.tyerslab.com/. Centerlines show the medians. Box limits indicate the 25th and 75th percentiles as determined by R software. Whiskers extend 1.5 times the interquartile range from the 25th and 75th percentiles. n = 21 and 18 sample points. (f) Schematic for the model of how CENP-A vs. topo-II impacts chromosome length and the model of centromere expansion vs. neo-centromere formation. Bars, 5 µm. *, P < 0.01.

References

    1. Adachi Y., Luke M., and Laemmli U.K.. 1991. Chromosome assembly in vitro: Topoisomerase II is required for condensation. Cell. 64:137–148. 10.1016/0092-8674(91)90215-K - DOI - PubMed
    1. Belton J.-M., McCord R.P., Gibcus J.H., Naumova N., Zhan Y., and Dekker J.. 2012. Hi–C: A comprehensive technique to capture the conformation of genomes. Methods. 58:268–276. 10.1016/j.ymeth.2012.05.001 - DOI - PMC - PubMed
    1. Bembenek J.N., Verbrugghe K.J.C., Khanikar J., Csankovszki G., and Chan R.C.. 2013. Condensin and the spindle midzone prevent cytokinesis failure induced by chromatin bridges in C. elegans embryos. Curr. Biol. 23:937–946. 10.1016/j.cub.2013.04.028 - DOI - PMC - PubMed
    1. Black B.E., Brock M.A., Bédard S., Woods V.L. Jr., and Cleveland D.W.. 2007. An epigenetic mark generated by the incorporation of CENP-A into centromeric nucleosomes. Proc. Natl. Acad. Sci. USA. 104:5008–5013. 10.1073/pnas.0700390104 - DOI - PMC - PubMed
    1. Blower M.D., Sullivan B.A., and Karpen G.H.. 2002. Conserved organization of centromeric chromatin in flies and humans. Dev. Cell. 2:319–330. 10.1016/S1534-5807(02)00135-1 - DOI - PMC - PubMed

Publication types

MeSH terms

LinkOut - more resources