. 2017 Aug 23;37(34):8102-8115.
doi: 10.1523/JNEUROSCI.0473-17.2017. Epub 2017 Jul 21.

ERK/MAPK Signaling Is Required for Pathway-Specific Striatal Motor Functions

Affiliations

ERK/MAPK Signaling Is Required for Pathway-Specific Striatal Motor Functions

Scott R Hutton et al. J Neurosci. .

Abstract

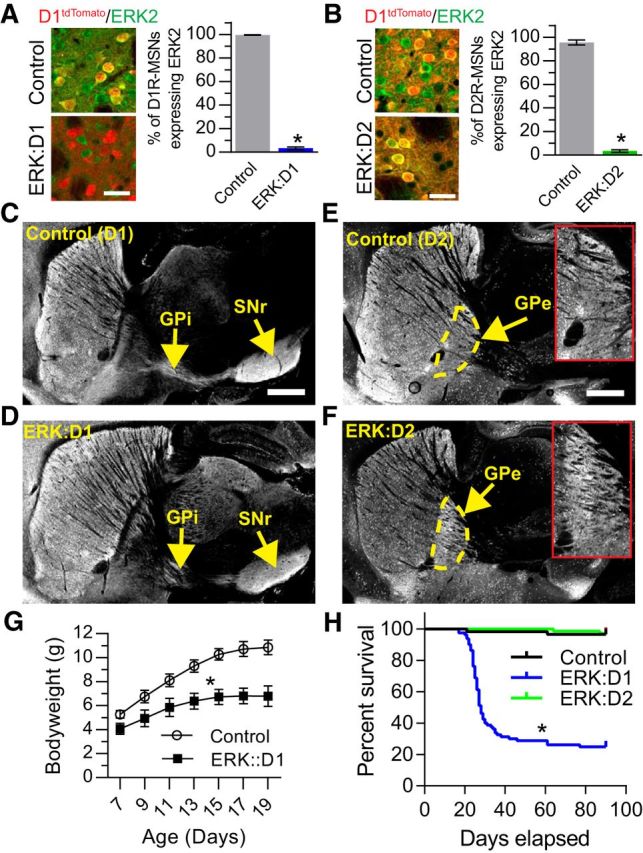
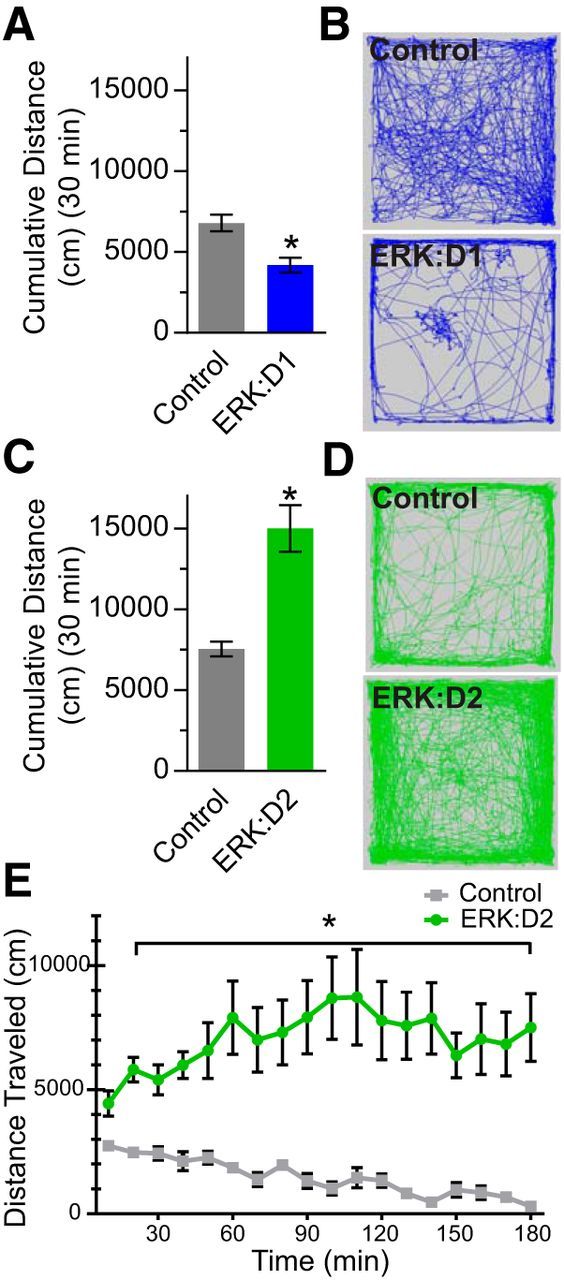
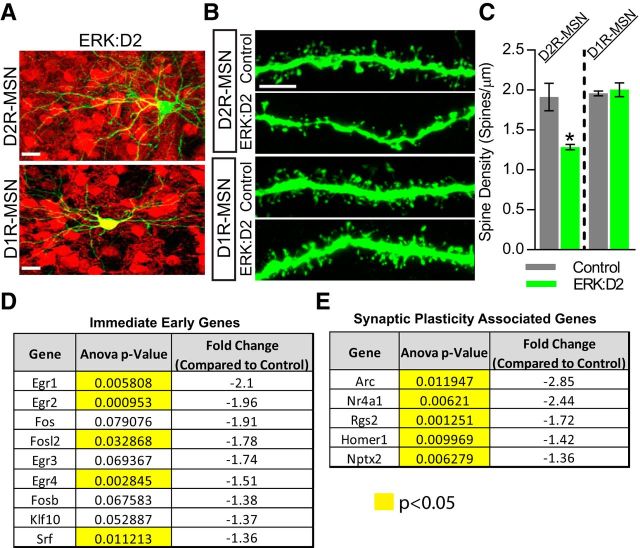
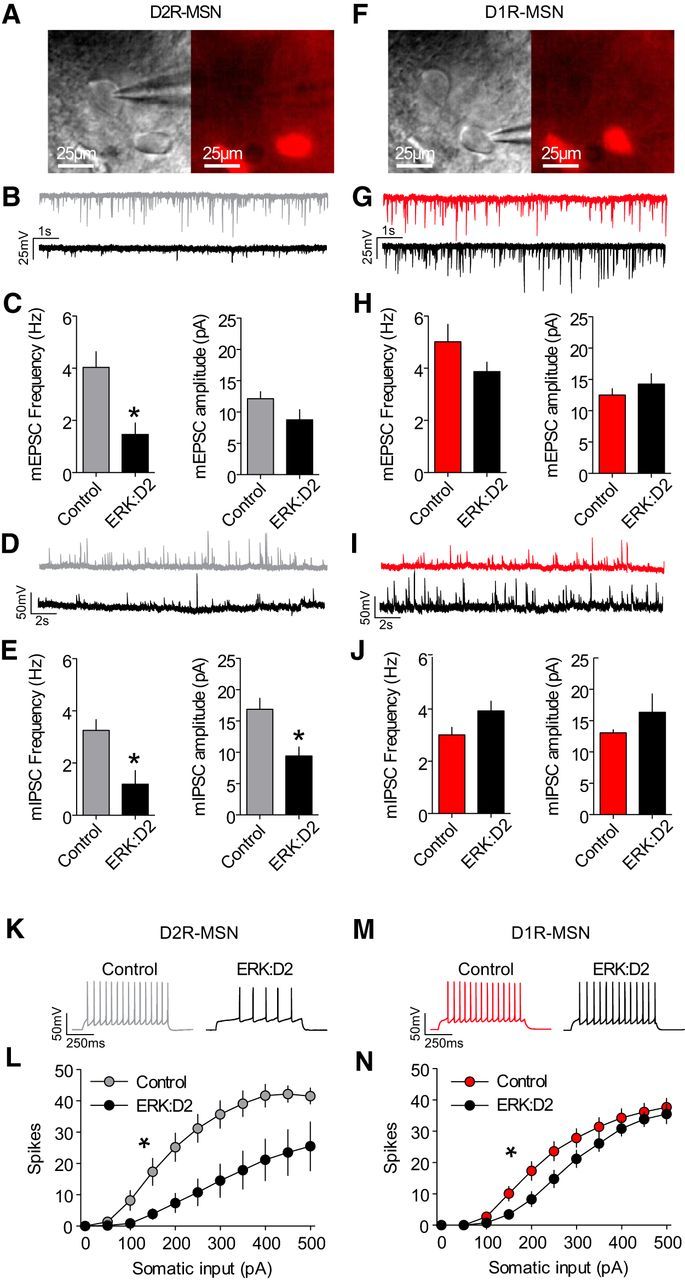
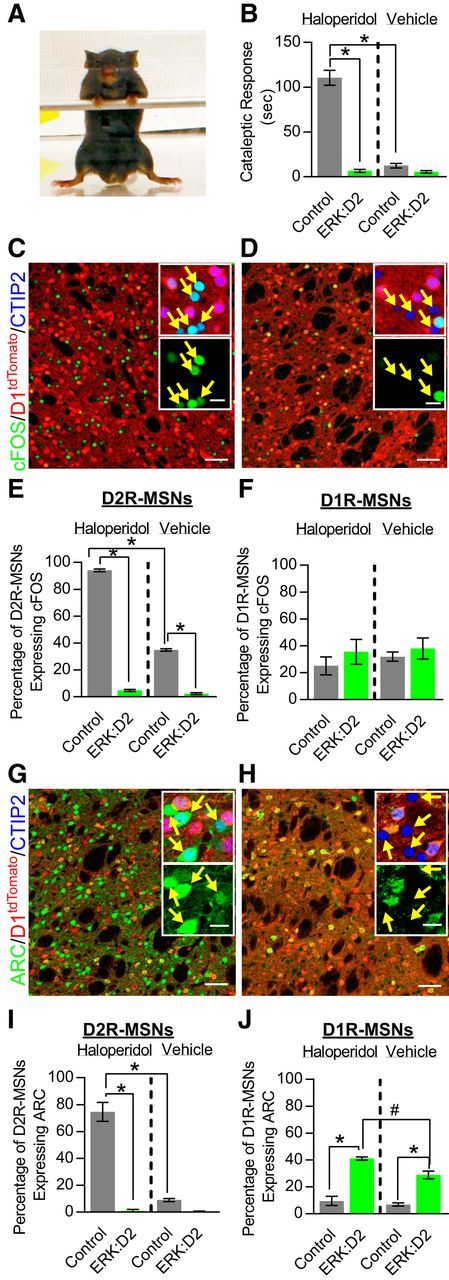
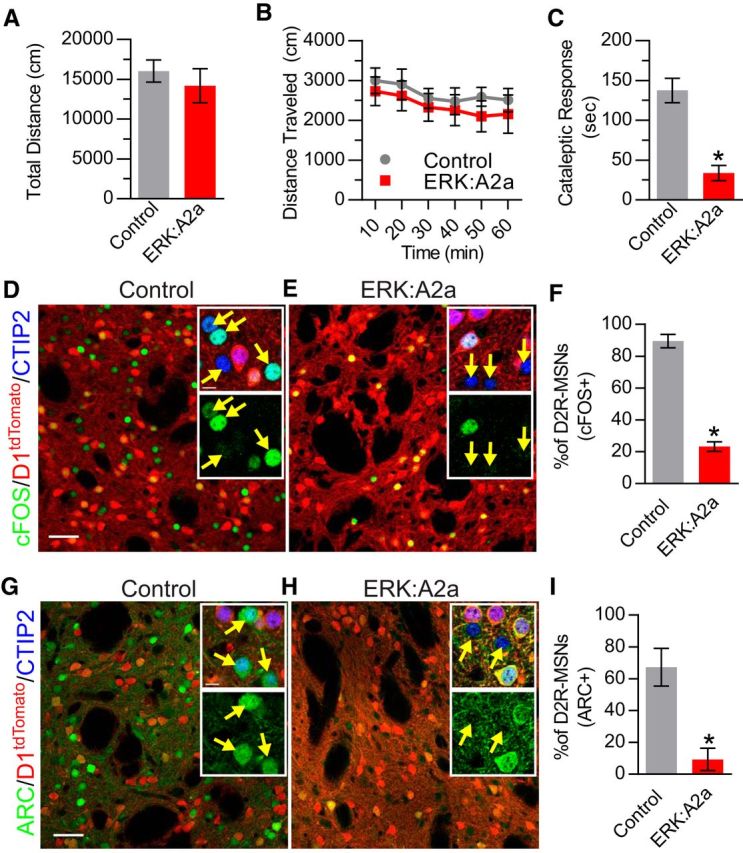
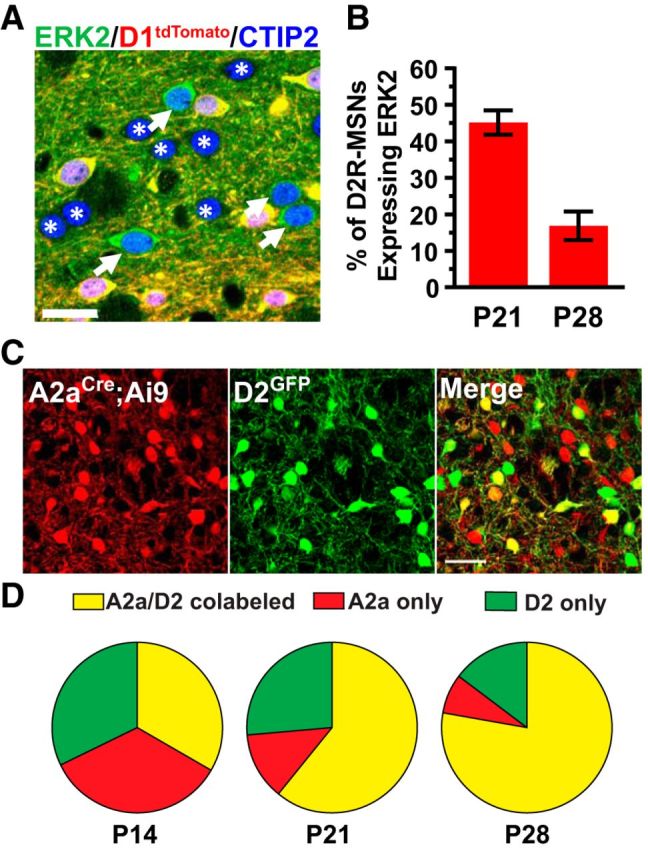
The ERK/MAPK intracellular signaling pathway is hypothesized to be a key regulator of striatal activity via modulation of synaptic plasticity and gene transcription. However, prior investigations into striatal ERK/MAPK functions have yielded conflicting results. Further, these studies have not delineated the cell-type-specific roles of ERK/MAPK signaling due to the reliance on globally administered pharmacological ERK/MAPK inhibitors and the use of genetic models that only partially reduce total ERK/MAPK activity. Here, we generated mouse models in which ERK/MAPK signaling was completely abolished in each of the two distinct classes of medium spiny neurons (MSNs). ERK/MAPK deletion in D1R-MSNs (direct pathway) resulted in decreased locomotor behavior, reduced weight gain, and early postnatal lethality. In contrast, loss of ERK/MAPK signaling in D2R-MSNs (indirect pathway) resulted in a profound hyperlocomotor phenotype. ERK/MAPK-deficient D2R-MSNs exhibited a significant reduction in dendritic spine density, markedly suppressed electrical excitability, and suppression of activity-associated gene expression even after pharmacological stimulation. Our results demonstrate the importance of ERK/MAPK signaling in governing the motor functions of the striatal direct and indirect pathways. Our data further show a critical role for ERK in maintaining the excitability and plasticity of D2R-MSNs.SIGNIFICANCE STATEMENT Alterations in ERK/MAPK activity are associated with drug abuse, as well as neuropsychiatric and movement disorders. However, genetic evidence defining the functions of ERK/MAPK signaling in striatum-related neurophysiology and behavior is lacking. We show that loss of ERK/MAPK signaling leads to pathway-specific alterations in motor function, reduced neuronal excitability, and the inability of medium spiny neurons to regulate activity-induced gene expression. Our results underscore the potential importance of the ERK/MAPK pathway in human movement disorders.

Keywords: MAP kinase; activity-induced gene expression; basal ganglia; dendritic spine; hyperlocomotion; medium spiny neuron.


Figures

Figure 1.
Figure 1.
ERK-deficient MSNs show proper targeting of axonal projections. A, Quantification of the relative percentage of ERK2-positive D1R-MSNs in control and ERK:D1 mutant mice at P21. ERK2 (green) is coexpressed with D1tdTomato (red) in D1R-MSNs of littermate control mice, but is lost in virtually all D1R-MSNs of ERK:D1 mutant mice (*p < 0.001; n = 3 mice/genotype, 150 cells/mouse). Scale bar, 50 μm. B, Quantification of the percentage of ERK2-postive D2R-MSNs in littermate control and ERK:D2 mutant mice at P21. ERK2 (green) is expressed in in both D1tdTomato-positive D1R-MSNs and D1tdTomato-negative D2R-MSNs of littermate control mice, but is lost in virtually all D1tdTomato-negative D2R-MSNs of ERK:D2 mutant mice (*p < 0.001; n = 3 mice/genotype, 150 cells/mouse). Scale bar, 50 μm. C, D, Control (ERK−/−;ERK2w/w:D1Cre) and ERK:D1 mutant mice were backcrossed with Cre-dependent fluorescent reporter Ai3 mice to label all D1R-MSN projections with enhanced yellow fluorescent protein (eYFP). Normal D1R axon targeting to the GPi and SNr is observed in control (C) and ERK:D1 mutant (D) mice. Scale bar, 1 mm. E, F, Control (ERK−/−;ERK2w/w:D2Cre) and ERK:D2 mutant mice were backcrossed with Ai3 mice to label D2R-MSN axonal projections with eYFP. Normal D2R axon targeting to the GPe is observed in control (E) and ERK:D2 mutant (F) mice. Insets show magnified images of GPe. Scale bar, 1 mm. G, Quantification of weight gain during the second and third postnatal weeks in ERK:D1 mutant mice compared with ERK−/−;ERK2 Fl/Fl littermate controls. ERK:D1 animals show significant deficits in weight gain beginning at P7 and continuing through P19 (n = 6 animals/genotype, main effect for genotype F(1,10) = 84.96, *p < 0.0001, Bonferroni post hoc comparison). H, Kaplan–Meier survival curve of ERK:D1 (blue line, n = 80 mice) and ERK:D2 (green line; n = 71 mice) mice compared with ERK1−/−;ERK2Fl/Fl controls (black line, n = 57 mice). ERK:D1 mice show a significant reduction in survival (*p < 0.0001, post hoc Gehan–Breslow–Wilcoxon test). All data are presented as mean ± SEM.
Figure 2.
Figure 2.
ERK signaling is required for pathway-specific regulation of locomotor behavior. A, Quantification of total distance traveled in a 30 min testing period by ERK:D1 (blue bar) and paired littermate control (gray bar) mice at P21. ERK:D1 animals show a significant reduction in locomotor activity (*p < 0.01, n = 10 mice/genotype). B, Representative recordings of total distance traveled (30 min) in control and ERK:D1 animals. C, Quantification of total distance traveled in a 30 min testing period by ERK:D2 mutant mice (green bar) and paired littermate controls (gray bar). ERK:D2 mutants show significantly more locomotor activity than controls (*p < 0.001, n = 10mice/genotype). D, Representative tracks of cumulative open-field activity for control and ERK:D2 mutant mice. E, Three hour open-field analysis of ERK:D2 mice and controls. Shown is total distance traveled as a function of time. ERK:D2 mutant mice (green trace) showed significantly increased movement throughout the entire 3 h testing period compared with control animals (gray trace), which steadily reduce activity throughout the trial (*p < 0.001; n = 10 mice/genotype). All data are presented as mean ± SEM.
Figure 3.
Figure 3.
ERK signaling is required for proper spinogenesis and expression of synaptic plasticity genes. A, Representative images of D1R-MSN and D2R-MSNs labeled with AAV8-CAG-GFP virus (green). D1R-MSNs are identified by their expression of the D1tdTomato transgene (red) and D2R-MSNs are D1tdTomato negative. GFP-expressing D2R-MSNs appear green, whereas GFP-expressing D1R-MSNs appear yellow. Scale bar, 20 μm. B, AAV8-CAG-GFP efficiently labels MSN dendritic spines. D2R-MSNs in ERK:D2 mutant mice show a significant reduction in spine density compared with littermate controls. In contrast, there is no difference in spine density on D1R-MSNs between mutant and control animals. Scale bar, 5 μm. C, Quantification of mean spine density shows a reduction in dendritic spines in D2R-MSNs (*p < 0.05; n = 3 mice/genotype, 15 dendrites/mouse), but not D1R-MSNs (p < 0.65; n = 3 mice/genotype, 15 dendrites/mouse), in ERK:D2 mutant mice compared with littermate controls. D, E, Microarray analysis of P17 striatum (n = 3 male mice/genotype) showing dramatic reduction in the expression of activity-induced immediate early genes (D) and genes associated with synaptic plasticity (E). *p < 0.05.
Figure 4.
Figure 4.
Markedly reduced excitability of ERK-deleted D2R-MSNs. A, Image of pipette recording from a D2R-MSN negative for D1tdTomato (red). B, Representative mEPSC recordings of D2R-MSNs from control (gray) and ERK:D2 mutant (black) mice. C, Summary of mEPSC frequencies and amplitudes from control (gray; n = 3 mice, n = 10 neurons) and ERK:D2 mutant (black; n = 3 mice, n = 8 neurons) D2R-MSNs. mEPSC frequency is significantly reduced in ERK:D2 mutant D2R-MSNs (*p < 0.01), whereas mEPSC amplitude is unchanged. D, Representative mIPSC recordings of D2R-MSNs from control (gray) and ERK:D2 mutant (black) mice. E, Summary of mIPSC frequencies and amplitudes from control (gray; n = 3 mice; n = 10 neurons) and ERK:D2 mutant (black; n = 3 mice; n = 7 neurons) D2R-MSNs. Both mIPSC frequency and amplitude are reduced significantly in ERK:D2 mutant D2-MSNs (*p < 0.01). F, Representative image of recording pipette in a D1tdTomato-positive (red) D1R-MSN. G, Representative mEPSC recordings of D1R-MSNs from control (red) and ERK:D2 mutant (black) mice. H, Summary of mEPSC frequencies and amplitudes from control (red; n = 3 mice; n = 8 neurons) and ERK:D2 mutant (black; n = 3 mice; n = 7 neurons) D1R-MSNs. There is no significant change in mEPSC frequency or amplitude in ERK:D2 mutant D1R-MSNs compared with control. I, Representative mIPSC recordings of D1R-MSNs from control (red) and ERK:D2 mutant (black) mice. J, Summary of mIPSC frequencies and amplitudes from control (red; n = 3 mice; n = 8 neurons) and ERK:D2 mutant (black; n = 3 mice; n = 7 neurons) D1R-MSNs. There is no significant difference between ERK:D2 mutant D1R-MSNs and control MSNs. K, Representative traces of whole-cell patch-clamp recordings from D2R-MSNs in control (gray) and ERK:D2 mutant (black) mice. L, Relationship between elicited action potential responses and somatic current injection in D2R-MSNs of control (gray; n = 3 mice; n = 9 neurons) and ERK:D2 mutant (black; n = 3 mice; n = 10 neurons) mice. D2R-MSNs from ERK:D2 mutant mice have a significantly reduced capacity to elicit action potentials (*p < 0.001). M, Representative traces of whole-cell patch-clamp recordings from D1R-MSNs in control (red) and ERK:D2 mutant (black) mice. N, Relationship between elicited action potential responses and somatic current injection in D1R-MSNs of control (red; n = 3 mice; n = 9 neurons) and ERK:D2 mutant (black; n = 3 mice; n = 9 neurons) mice. Intrinsic excitability in D1R-MSNs of ERK:D2 mutant mice was slightly, but significantly, reduced compared with controls (*p < 0.01).
Figure 5.
Figure 5.
Activity-regulated gene expression is strongly suppressed in ERK-deleted D2R-MSNs. A, Representative image of cataleptic response to haloperidol using horizontal bar test. B, Quantification of cataleptic response (freezing) to haloperidol (1 mg/kg) or vehicle in littermate control and ERK:D2 mutant mice. Control mice exhibit a robust cataleptic response to haloperidol compared with vehicle-treated controls (*p = 0.001, n = 7 mice/genotype/condition). The cataleptic response is effectively abolished in the mutant mice (*p = 0.001, haloperidol-treated ERK:D2 vs haloperidol treated control; n = 7 mice/condition). Vehicle-treated mice show no cataleptic response (n = 7 mice per genotype per treatment). C, D, c-FOS (green) expression in control and ERK:D2 mutant striatum 1 h after haloperidol administration. CTIP2 (blue) identifies all MSNs; D1tdTomato (red) identifies the D1R-MSN subpopulation. All D2R-MSNs are CTIP2(+);tdTomato(−). Insets are magnified images showing all three labels (top) and c-FOS only (bottom) demonstrating that c-FOS is strongly upregulated in D2R-MSNs (yellow arrows) in control (C) but not ERK:D2 animals (D). E, Quantification of MSN-specific c-FOS expression after haloperidol (1 mg/kg) or vehicle administration (*p < 0.001; n = 3 mice/genotype; 200–250 cells/mouse). F, No changes in c-FOS expression are observed in D1R-MSNs in either control or ERK:D2 mutant animals. (n = 3 animals/genotype, 200–250 cells/animal). G, H, ARC (green) expression in control and ERK:D2 mutant striatum 1 h after haloperidol administration. CTIP2 (blue) identifies all MSNs; D1tdTomato (red) identifies the D1R-MSN subpopulation. All D2R-MSNs are CTIP2(+);tdTomato(−). Insets are magnified images demonstrating that ARC is upregulated in D2R-MSNs (yellow arrows) in control (G) but not ERK:D2 animals (H). I, Quantification of D2R-MSN-specific ARC expression after haloperidol (1 mg/kg) or vehicle administration (*p < 0.001; n = 3 mice/genotype; 200–250 cells/mouse). J, D1R-MSNs in ERK:D2 mutant mice express significantly more ARC compared with controls regardless of treatment (#p < 0.05, *p < 0.001; n = 3 mice/genotype; 200–250 cells/mouse). All data are presented as mean ± SEM. Scale bar, 50 μm; inset, 10 μm.
Figure 6.
Figure 6.
Basal and haloperidol-induced behavioral and gene expression changes in ERK:A2a mice. A, B, Open-field locomotor testing of ERK:A2a and control mice (n = 7 animals/genotype). A, There is no significant difference in cumulative distance traveled (1 h test) between ERK:A2a mutant and control littermates. B, Total distance traveled as a function of time. No differences are observed between mutant and control animals. C, Cataleptic response 1 h after haloperidol administration (1 mg/kg). ERK:A2a mutant mice have a significantly reduced cataleptic response compared with littermate controls (*p < 0.001; n = 6 mice/genotype). D, E, Immunohistochemical labeling of activity-induced gene expression 1 h after haloperidol administration. All MSNs are labeled with Ctip2 (blue). D1R-MSNs are distinguished from D2R-MSNs by their expression of D1tdTomato(red). c-FOS (green) is upregulated in D2R-MSNs of control (D) but not ERK:A2a mutant (E) mice. Insets show higher magnification of all three labels (top) and c-FOS only (bottom). D2R-MSNs are indicated by yellow arrows. F, Quantitative analysis showing a significant reduction in the percentage of D2R-MSNs expressing c-FOS in ERK:A2a mutant animals compared with control animals (*p < 0.001; n = 3 mice/genotype; 200–250 cells/mouse). G, H, ARC (green) is upregulated in D2R-MSNs (yellow arrows) in control (G) but not ERK:A2a mutant (H) animals. I, Quantitative analysis demonstrating a significant decrease in the percentage of D2R-MSNs that upregulate ARC in ERK:A2a mutant mice (*p < 0.05; n = 3 mice/genotype; 200–250 cells/mouse). All data are presented as mean ± SEM. Scale bars, 50 μm; inset, 20 μm.
Figure 7.
Figure 7.
Delayed loss of ERK activity in ERK:A2a mice. A, Representative image of P21 ERK:A2a striatum. CTIP2 (blue) labels all MSNs, whereas D2R-MSNs are identified as negative for D1tdTomato expression (red). A subpopulation of D2R-MSNs in ERK:A2a mutants maintain ERK2 expression (green, white arrows). ERK2-deficient D2R-MSNs are indicated with a white asterisk. Scale bar, 20 μm. B, Quantitative analysis of ERK2 expression in P21 and P28 ERK:A2a striatum. Approximately half of all D2R-MSNs maintain ERK2 expression at P21. By 28, ∼15% of D2R-MSNs continue to express ERK2. (n = 3 animals/genotype; 500–600cells/animal). C, Colocalization of D2GFP (green) and A2aCre:Ai9 (red) at P14. Scale bar, 50 μm. D, Quantification of D2GFP and A2aCre:Ai9 colocalization at P14, P21, and P28. All data are presented as a percentage of total D2R-MSNs counted. Note that the percentage of D2R-MSNs that express both GFP and Ai9 is low at P14. The percentage increases over time, but complete recombination in D2R-MSNs is not observed, even by P28 (n = 3 animals/time point; 500–600 cells/animal). All data are presented as mean ± SEM.

References

    1. Adams JP, Anderson AE, Varga AW, Dineley KT, Cook RG, Pfaffinger PJ, Sweatt JD (2000) The A-type potassium channel Kv4.2 is a substrate for the mitogen-activated protein kinase ERK. J Neurochem 75:2277–2287. - PubMed
    1. Ade KK, Wan Y, Chen M, Gloss B, Calakos N (2011) An improved BAC transgenic fluorescent reporter line for sensitive and specific identification of striatonigral medium spiny neurons. Front Syst Neurosci 5:32. 10.3389/fnsys.2011.00032 - DOI - PMC - PubMed
    1. Alonso M, Medina JH, Pozzo-Miller L (2004) ERK1/2 activation is necessary for BDNF to increase dendritic spine density in hippocampal CA1 pyramidal neurons. Learn Mem 11:172–178. 10.1101/lm.67804 - DOI - PMC - PubMed
    1. Arlotta P, Molyneaux BJ, Jabaudon D, Yoshida Y, Macklis JD (2008) Ctip2 controls the differentiation of medium spiny neurons and the establishment of the cellular architecture of the striatum. J Neurosci 28:622–632. 10.1523/JNEUROSCI.2986-07.2008 - DOI - PMC - PubMed
    1. Bertran-Gonzalez J, Bosch C, Maroteaux M, Matamales M, Hervé D, Valjent E, Girault JA (2008) Opposing patterns of signaling activation in dopamine D1 and D2 receptor-expressing striatal neurons in response to cocaine and haloperidol. J Neurosci 28:5671–5685. 10.1523/JNEUROSCI.1039-08.2008 - DOI - PMC - PubMed

Publication types