Randomized Controlled Trial
. 2017 Aug;40(8):994-999.
doi: 10.2337/dc17-0636.

The Fallacy of Average: How Using HbA1c Alone to Assess Glycemic Control Can Be Misleading

Affiliations
Randomized Controlled Trial

The Fallacy of Average: How Using HbA1c Alone to Assess Glycemic Control Can Be Misleading

Roy W Beck et al. Diabetes Care. 2017 Aug.

Abstract

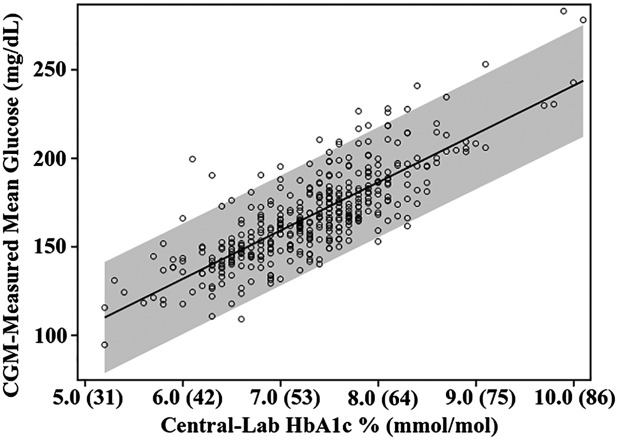
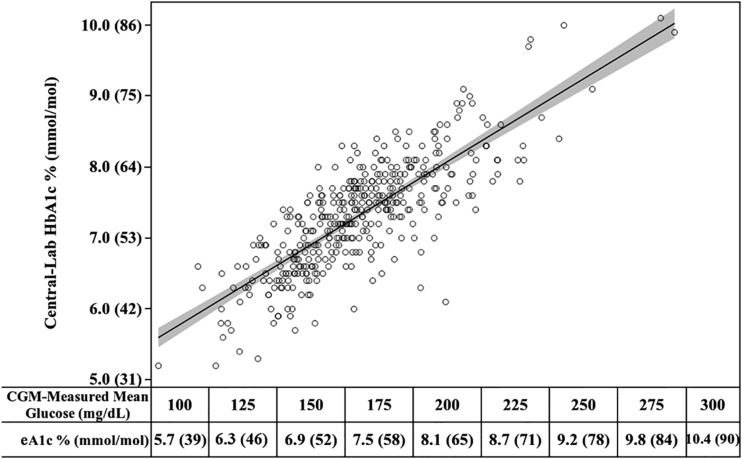
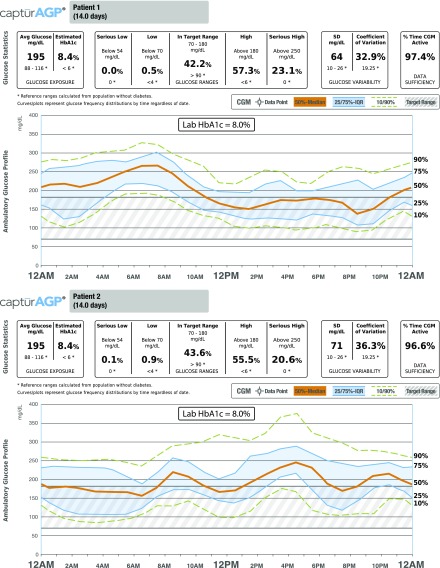
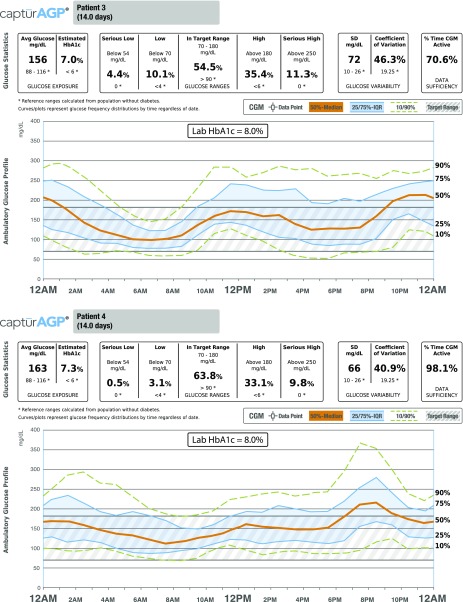
HbA1c is a valuable metric for comparing treatment groups in a randomized trial, for assessing glycemic trends in a population over time, or for cross-sectional comparisons of glycemic control in different populations. However, what is not widely appreciated is that HbA1c may not be a good indicator of an individual patient's glycemic control because of the wide range of mean glucose concentrations and glucose profiles that can be associated with a given HbA1c level. To illustrate this point, we plotted mean glucose measured with continuous glucose monitoring (CGM) versus central laboratory-measured HbA1c in 387 participants in three randomized trials, showing that not infrequently HbA1c may underestimate or overestimate mean glucose, sometimes substantially. Thus, if HbA1c is to be used to assess glycemic control, it is imperative to know the patient's actual mean glucose to understand how well HbA1c is an indicator of the patient's glycemic control. With knowledge of the mean glucose, an estimated HbA1c (eA1C) can be calculated with the formula provided in this article to compare with the measured HbA1c. Estimating glycemic control from HbA1c alone is in essence applying a population average to an individual, which can be misleading. Thus, a patient's CGM glucose profile has considerable value for optimizing his or her diabetes management. In this era of personalized, precision medicine, there are few better examples with respect to the fallacy of applying a population average to a specific patient rather than using specific information about the patient to determine the optimal approach to treatment.


Figures

Figure 1
Figure 1
Plot of CGM-measured mean glucose concentration vs. laboratory-measured HbA1c. The shaded area represents the 95% prediction interval (analogous to an individual CI) for a patient’s mean glucose concentration for a measured HbA1c level, demonstrating the wide range of mean glucose concentration values that are possible for any HbA1c value.
Figure 2
Figure 2
Plot of laboratory-measured HbA1c vs. CGM-measured mean glucose concentration used to derive eA1C. The shaded area represents the 95% CI for the population mean HbA1c estimated from a mean glucose concentration. Equation to estimate HbA1c for a given mean glucose concentration: eA1C = 3.38 + 0.02345 × [mean glucose] (23,24).
Figure 3
Figure 3
AGPs from four patients with laboratory-measured HbA1c of 8.0%. AGPs are shown for four adults with type 1 diabetes using multiple daily injections of insulin, all with an HbA1c of 8.0% from the same central reference laboratory. Displayed are 2 weeks of CGM data (up to 288 CGM values/day) for each patient measured just prior to the HbA1c laboratory test. The CGM is displayed as a modal or standard day. Shown are the median lines of all the glucose values over 2 weeks, the 25% and 75% lines (enclosing the shaded interquartile range [IQR]), and the 10% and 90% lines (dashed). The hatched area is the target glucose range of 70–180 mg/dL. Clinical note 1: Although each of the four patients has the same HbA1c, the AGP patterns are very different and would suggest different insulin and or lifestyle interventions. Clinical note 2: The mean glucose varies from 156 to 195 mg/dL among the four patients. For patients 1 and 2, eA1C (8.4%) based on mean CGM glucose (195 mg/dL) is slightly higher than the measured HbA1c (8.0%), indicating that the measured HbA1c is slightly underestimating the mean glucose and that despite the same mean glucose, the daily pattern varies considerably. For patients 3 and 4, eA1C (7.0% and 7.3%, respectively) based on the mean CGM glucose (156 and 163 mg/dL, respectively) is substantially lower than the measured HbA1c (8.0%), indicating that the measured HbA1c is overestimating the mean glucose. Again, despite similar mean glucose concentrations, the daily pattern has considerable variation between the two patients. Avg, average.
Figure 3
Figure 3
AGPs from four patients with laboratory-measured HbA1c of 8.0%. AGPs are shown for four adults with type 1 diabetes using multiple daily injections of insulin, all with an HbA1c of 8.0% from the same central reference laboratory. Displayed are 2 weeks of CGM data (up to 288 CGM values/day) for each patient measured just prior to the HbA1c laboratory test. The CGM is displayed as a modal or standard day. Shown are the median lines of all the glucose values over 2 weeks, the 25% and 75% lines (enclosing the shaded interquartile range [IQR]), and the 10% and 90% lines (dashed). The hatched area is the target glucose range of 70–180 mg/dL. Clinical note 1: Although each of the four patients has the same HbA1c, the AGP patterns are very different and would suggest different insulin and or lifestyle interventions. Clinical note 2: The mean glucose varies from 156 to 195 mg/dL among the four patients. For patients 1 and 2, eA1C (8.4%) based on mean CGM glucose (195 mg/dL) is slightly higher than the measured HbA1c (8.0%), indicating that the measured HbA1c is slightly underestimating the mean glucose and that despite the same mean glucose, the daily pattern varies considerably. For patients 3 and 4, eA1C (7.0% and 7.3%, respectively) based on the mean CGM glucose (156 and 163 mg/dL, respectively) is substantially lower than the measured HbA1c (8.0%), indicating that the measured HbA1c is overestimating the mean glucose. Again, despite similar mean glucose concentrations, the daily pattern has considerable variation between the two patients. Avg, average.

References

    1. Rose T. The End of Average: How We Succeed in a World That Values Sameness. New York, Harper Collins, 2015
    1. Cohen RM, Franco RS, Khera PK, et al. . Red cell life span heterogeneity in hematologically normal people is sufficient to alter HbA1c. Blood 2008;112:4284–4291 - PMC - PubMed
    1. Malka R, Nathan DM, Higgins JM. Mechanistic modeling of hemoglobin glycation and red blood cell kinetics enables personalized diabetes monitoring. Sci Transl Med 2016;8:359ra130. - PMC - PubMed
    1. Bergenstal RM, Gal RL, Connor CG, et al. . Racial differences in the relationship of glucose concentrations and hemoglobin A1c levels. Ann Intern Med. 10.7326/M16-2596 - DOI - PubMed
    1. Yudkin JS, Forrest RD, Jackson CA, Ryle AJ, Davie S, Gould BJ. Unexplained variability of glycated haemoglobin in non-diabetic subjects not related to glycaemia. Diabetologia 1990;33:208–215 - PubMed

Publication types