. 2017 Oct;24(10):505-518.
doi: 10.1530/ERC-17-0253. Epub 2017 Jul 21.

Acromegaly at diagnosis in 3173 patients from the Liège Acromegaly Survey (LAS) Database

Affiliations

Acromegaly at diagnosis in 3173 patients from the Liège Acromegaly Survey (LAS) Database

Patrick Petrossians et al. Endocr Relat Cancer. 2017 Oct.

Abstract

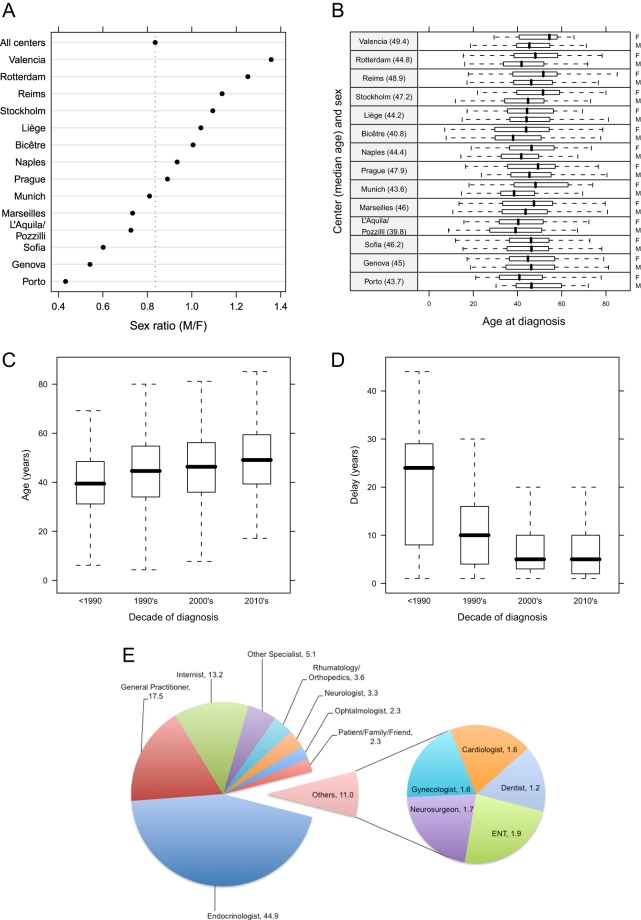
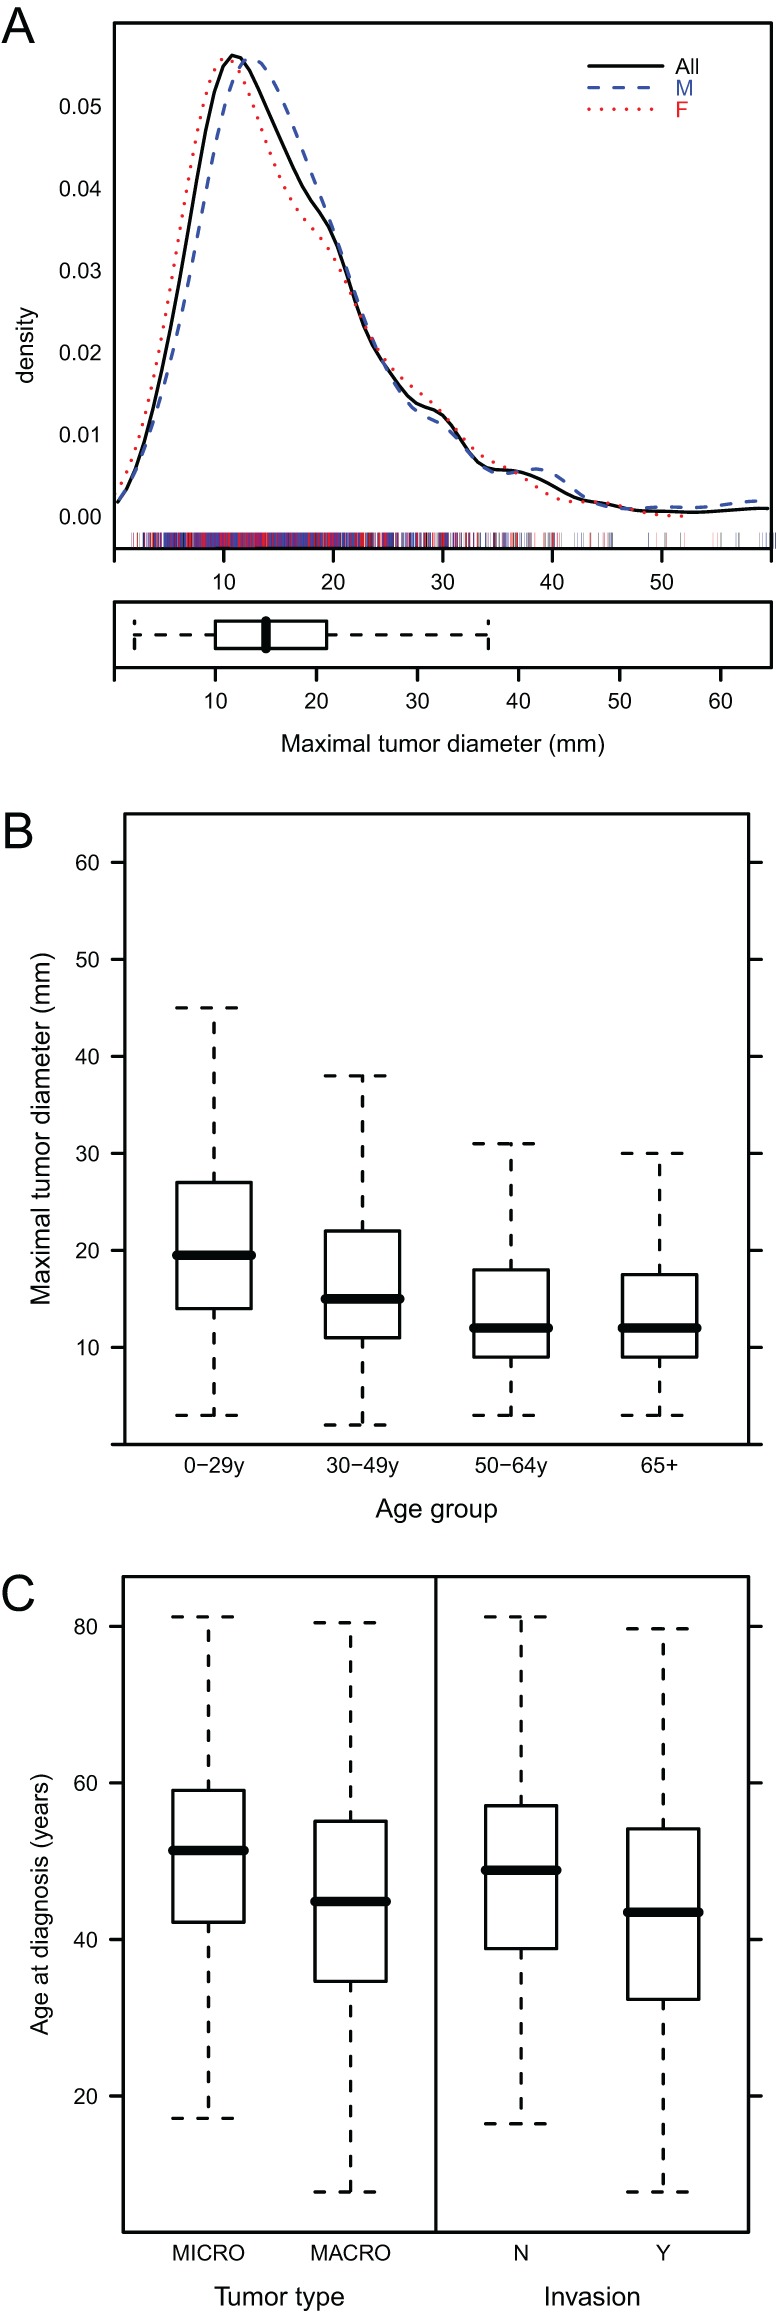
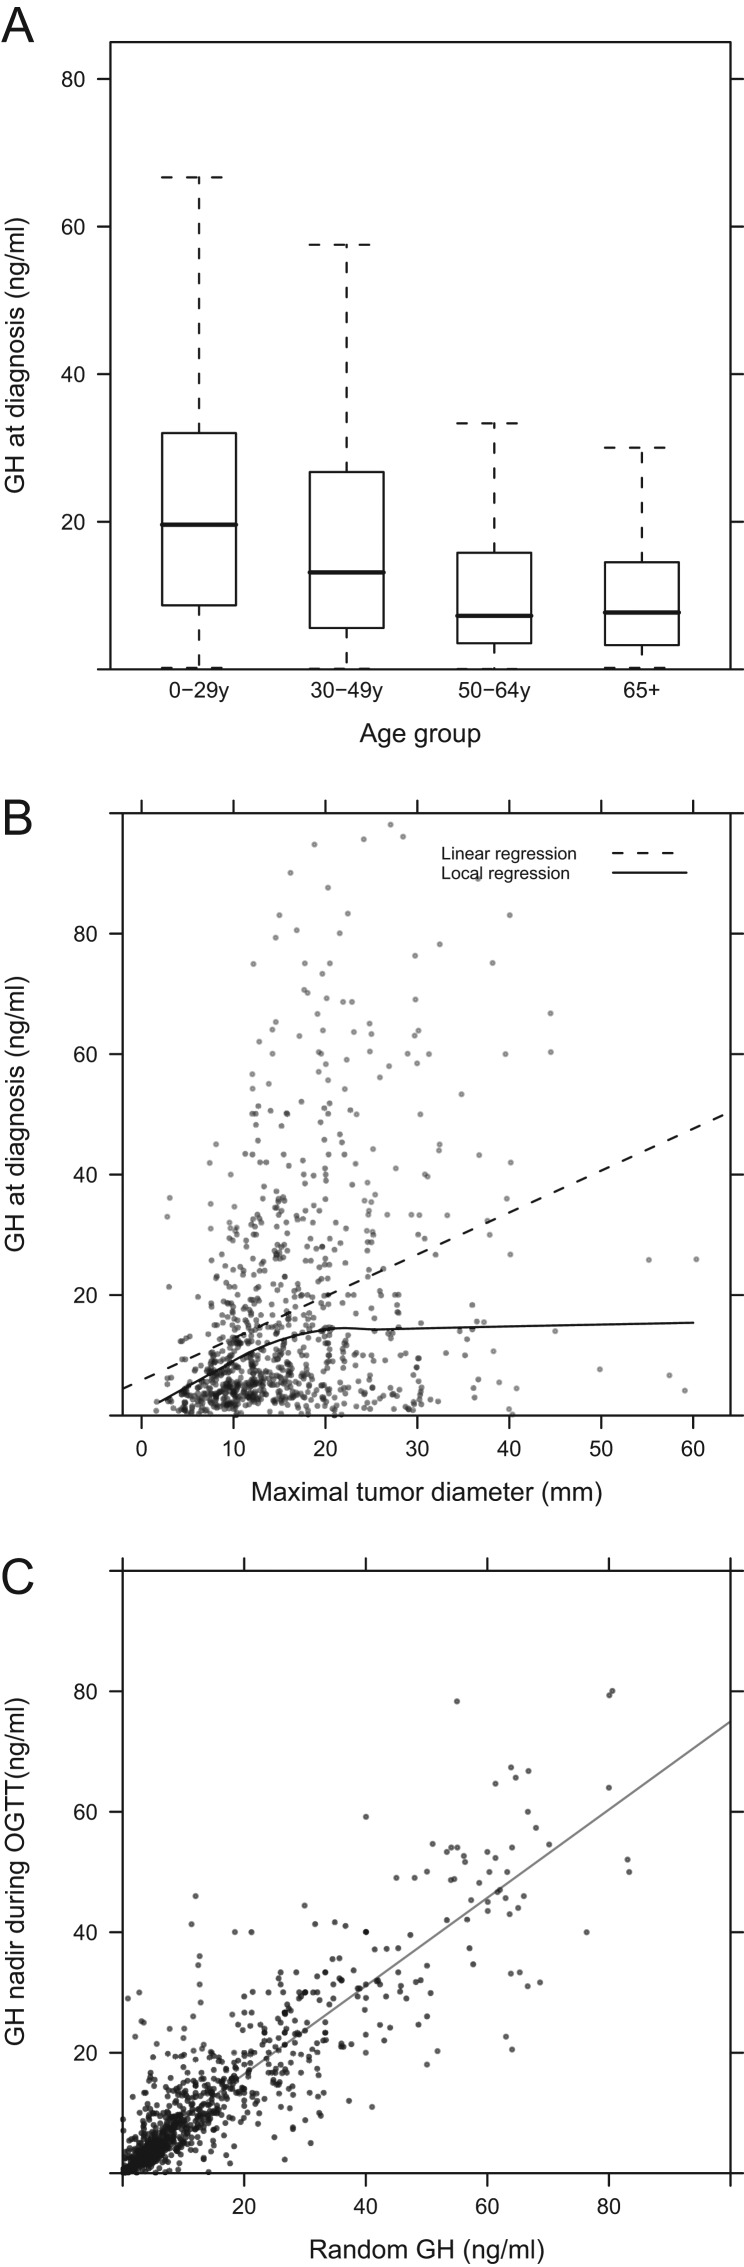
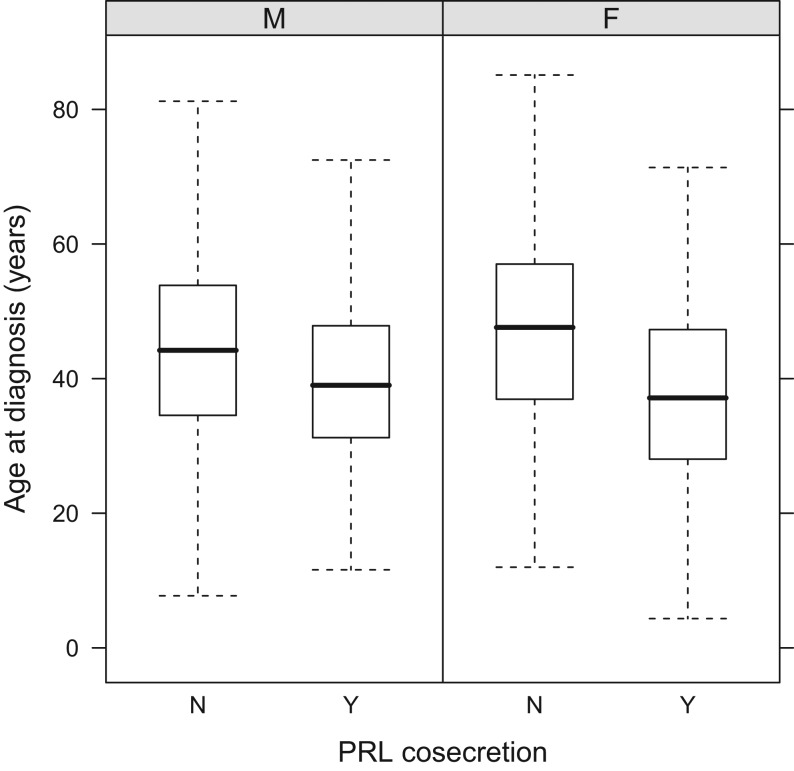
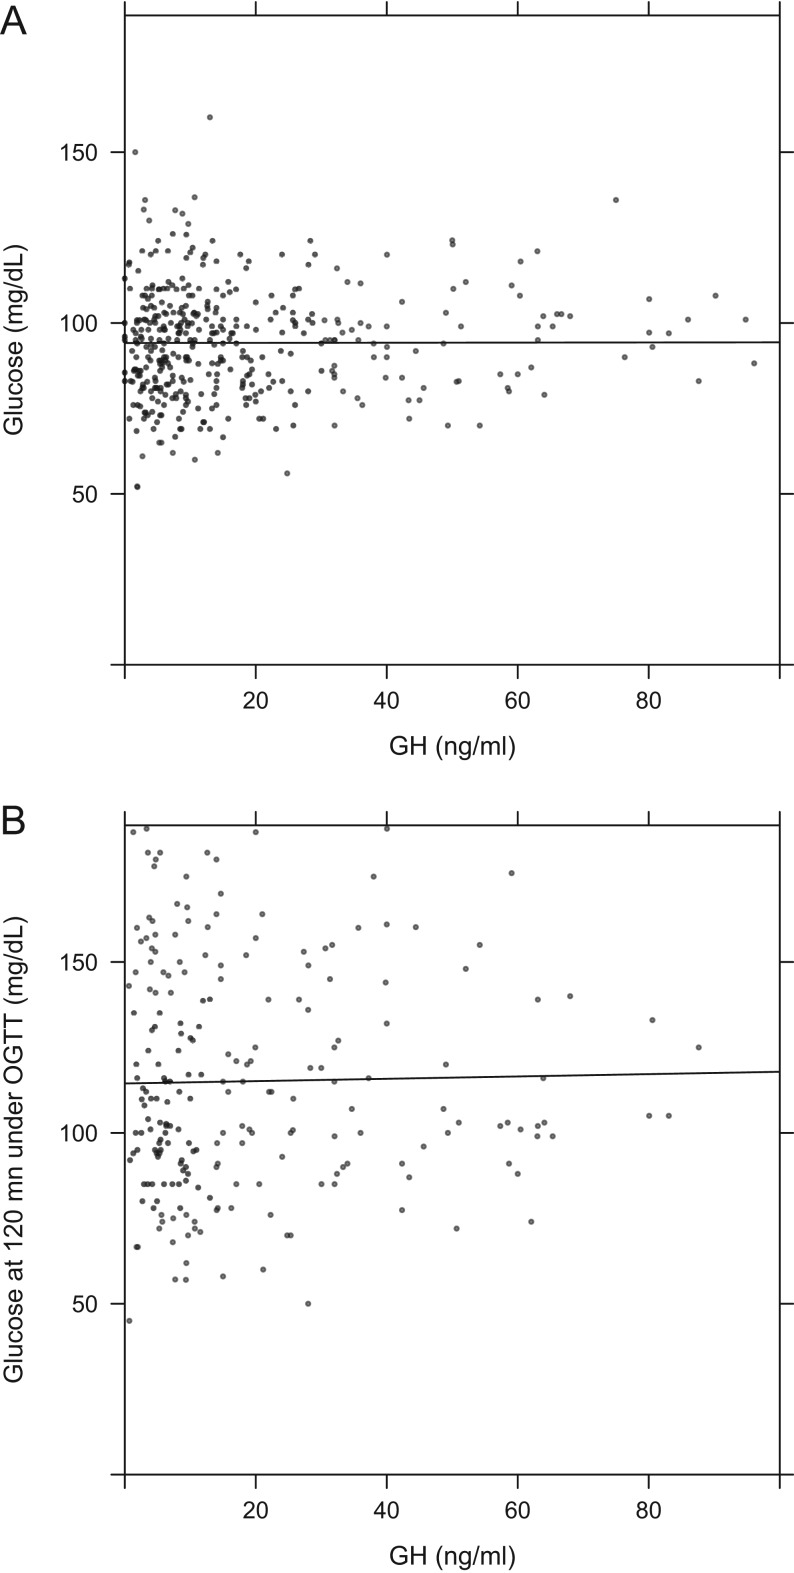
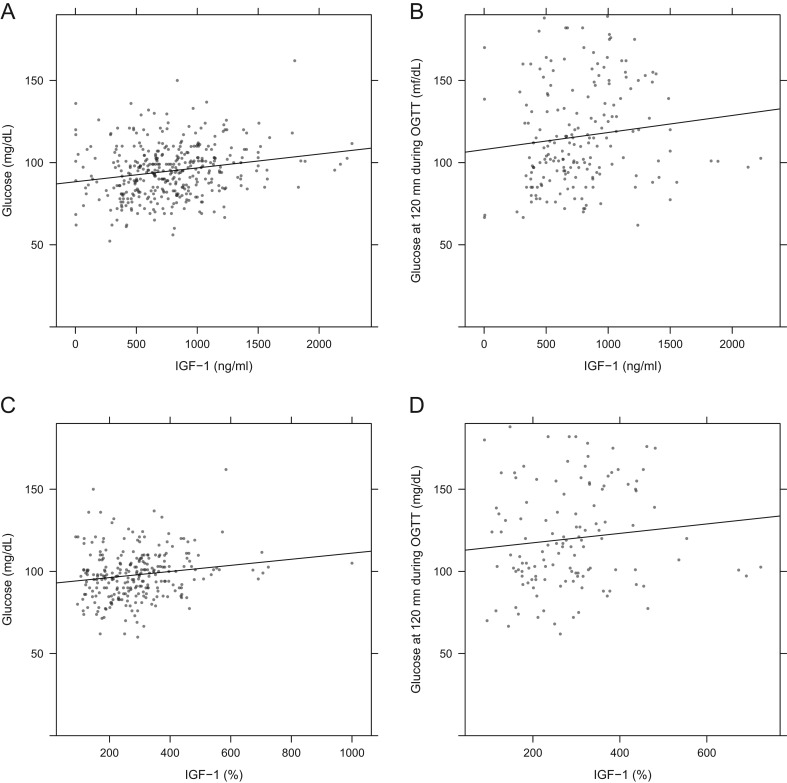
Acromegaly is a rare disorder caused by chronic growth hormone (GH) hypersecretion. While diagnostic and therapeutic methods have advanced, little information exists on trends in acromegaly characteristics over time. The Liège Acromegaly Survey (LAS) Database, a relational database, is designed to assess the profile of acromegaly patients at diagnosis and during long-term follow-up at multiple treatment centers. The following results were obtained at diagnosis. The study population consisted of 3173 acromegaly patients from ten countries; 54.5% were female. Males were significantly younger at diagnosis than females (43.5 vs 46.4 years; P < 0.001). The median delay from first symptoms to diagnosis was 2 years longer in females (P = 0.015). Ages at diagnosis and first symptoms increased significantly over time (P < 0.001). Tumors were larger in males than females (P < 0.001); tumor size and invasion were inversely related to patient age (P < 0.001). Random GH at diagnosis correlated with nadir GH levels during OGTT (P < 0.001). GH was inversely related to age in both sexes (P < 0.001). Diabetes mellitus was present in 27.5%, hypertension in 28.8%, sleep apnea syndrome in 25.5% and cardiac hypertrophy in 15.5%. Serious cardiovascular outcomes like stroke, heart failure and myocardial infarction were present in <5% at diagnosis. Erythrocyte levels were increased and correlated with IGF-1 values. Thyroid nodules were frequent (34.0%); 820 patients had colonoscopy at diagnosis and 13% had polyps. Osteoporosis was present at diagnosis in 12.3% and 0.6-4.4% had experienced a fracture. In conclusion, this study of >3100 patients is the largest international acromegaly database and shows clinically relevant trends in the characteristics of acromegaly at diagnosis.

Keywords: IGF-1; acromegaly; comorbidity; data mining; database; diagnosis; growth hormone; pituitary adenoma; symptoms.


Figures

Figure 1
Figure 1
(A) Dot plot showing the sex ratio (M/F) and the number (n) of patients in the LAS Database and for individual centers. Centers were sorted based on the sex ratio, in decreasing order. (B) Median age of patients at diagnosis represented as separate boxplots for males and females. Centers were sorted based on the median age of diagnosis of all patients for each center (values in parenthesis). (C) Evolution of median age at diagnosis over time. (D) Estimated delay between the first symptoms of acromegaly as reported by patients and the diagnosis of acromegaly, and displayed by the decade of diagnosis. (E) Proportions of LAS Database patients diagnosed by different medical (generalist, specialist) or health care workers and non-medical individuals.
Figure 2
Figure 2
(A) Density plot and box plot representing the maximal diameter of tumor at diagnosis. Data for the whole population (black line), male (blue line) and female patients (red line) are shown. Individual patients are represented below the density plot (‘rug’). (B) Maximal tumor diameter in groups of patients based on the age at diagnosis. (C) Age of patients at diagnosis in those with micro/macro adenomas and in those with tumor invasion.
Figure 3
Figure 3
(A) GH levels in groups of patients based on the age at diagnosis. (B) Scatterplot of GH levels at diagnosis vs maximal tumor diameter. The dotted line is the linear regression between these two variables, whereas the continuous line is the result of a loess (locally weighted least squares regression) smoothing. The latter shows the lack of a correlation between tumor size and GH secretion for larger tumors. (C) Scatterplot and regression line between GH nadir concentration during OGTT vs random GH measurement.
Figure 4
Figure 4
Age of male and female patients at diagnosis based on prolactin (PRL) co-secretion by the adenoma.
Figure 5
Figure 5
Scatter plots and regression lines of basal glucose (A) and glucose at 120 min during OGTT (B) vs GH levels in non-diabetic patients.
Figure 6
Figure 6
Scatter plots and regression lines of glucose vs IGF-1 levels in non-diabetic patients. (A) Basal glucose vs measured IGF-1. (B) Glucose at 120 min during OGTT vs measured IGF-1. (C) Basal glucose vs IGF-1 expressed as a percentage of the upper limit of normal (% ULN). (D) Glucose at 120 min during OGTT vs IGF-1 expressed as % of ULN.

Similar articles

Cited by

References

    1. Alexopoulou O, Bex M, Abs R, T’Sjoen G, Velkeniers B, Maiter D. 2008. Divergence between growth hormone and insulin-like growth factor-i concentrations in the follow-up of acromegaly. Journal of Clinical Endocrinology and Metabolism 93 1324–1330. ( 10.1210/jc.2007-2104) - DOI - PubMed
    1. Attal P, Chanson P. 2010. Endocrine aspects of obstructive sleep apnea. Journal of Clinical Endocrinology and Metabolism 95 483–495. ( 10.1210/jc.2009-1912) - DOI - PubMed
    1. Bajuk Studen K, Barkan A. 2008. Assessment of the magnitude of growth hormone hypersecretion in active acromegaly: reliability of different sampling models. Journal of Clinical Endocrinology and Metabolism 93 491–496. ( 10.1210/jc.2007-1451) - DOI - PMC - PubMed
    1. Bergamaschi S, Giavoli C, Ferrante E, Lania A, Rusconi R, Spada A, Beck-Peccoz P. 2006. Growth hormone replacement therapy in growth hormone deficient children and adults: effects on hemochrome. Journal of Endocrinological Investigation 29 399–404. ( 10.1007/BF03344122) - DOI - PubMed
    1. Bernabeu I, Pico A, Venegas E, Aller J, Alvarez-Escolá C, García-Arnés JA, Marazuela M, Jonsson P, Mir N, García Vargas M, et al. 2016. Safety of long-term treatment with Pegvisomant: analysis of Spanish patients included in global ACROSTUDY. Pituitary 19 127–137. ( 10.1007/s11102-015-0691-0) - DOI - PubMed

Publication types

Substances