. 2017 Sep 1;199(5):1555-1560.
doi: 10.4049/jimmunol.1700069. Epub 2017 Jul 21.

Cutting Edge: CD3 ITAM Diversity Is Required for Optimal TCR Signaling and Thymocyte Development

Affiliations

Cutting Edge: CD3 ITAM Diversity Is Required for Optimal TCR Signaling and Thymocyte Development

Matthew L Bettini et al. J Immunol. .

Abstract

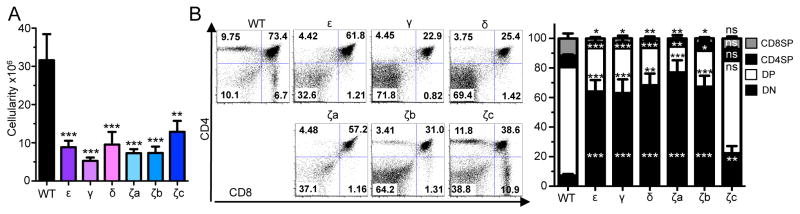
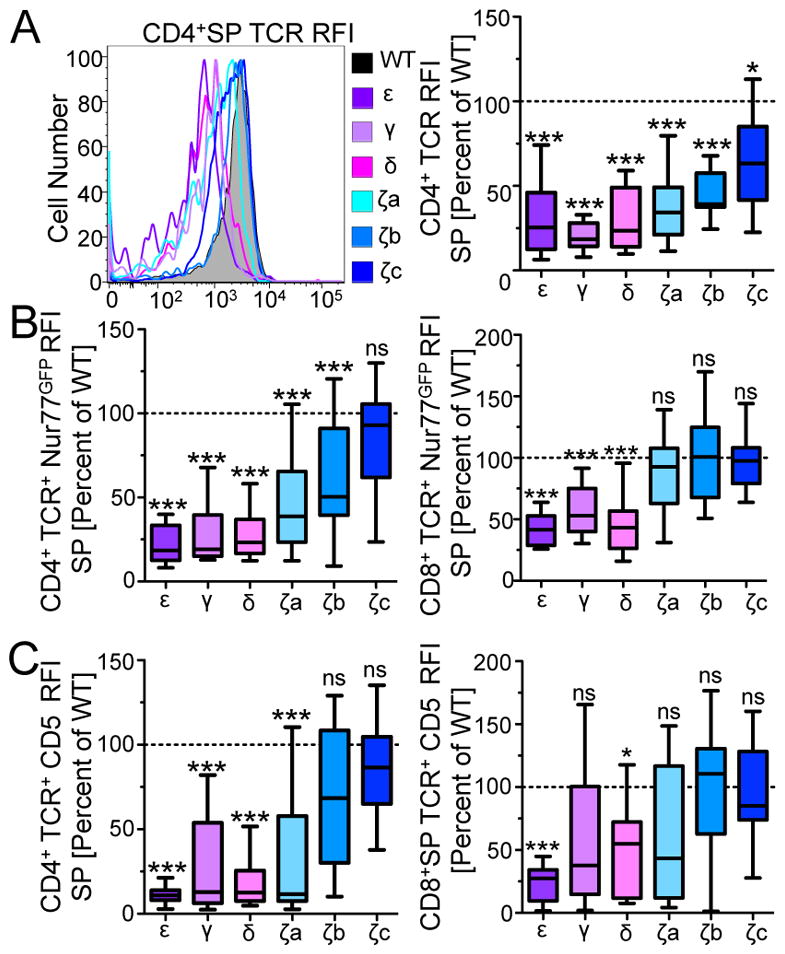
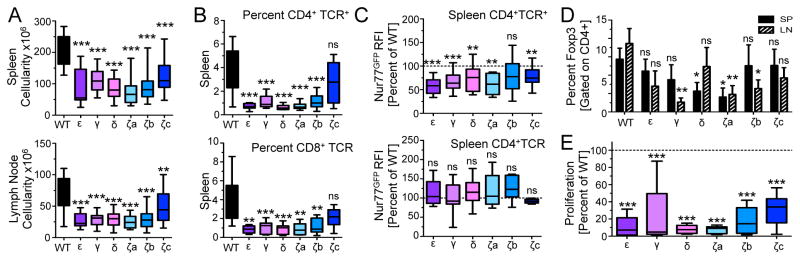
For the αβ or γδTCR chains to integrate extracellular stimuli into the appropriate intracellular cellular response, they must use the 10 ITAMs found within the CD3 subunits (CD3γε, CD3δε, and ζζ) of the TCR signaling complex. However, it remains unclear whether each specific ITAM sequence of the individual subunit (γεδζ) is required for thymocyte development or whether any particular CD3 ITAM motif is sufficient. In this article, we show that mice utilizing a single ITAM sequence (γ, ε, δ, ζa, ζb, or ζc) at each of the 10 ITAM locations exhibit a substantial reduction in thymic cellularity and limited CD4-CD8- (double-negative) to CD4+CD8+ (double-positive) maturation because of low TCR expression and signaling. Together, the data suggest that ITAM sequence diversity is required for optimal TCR signal transduction and subsequent T cell maturation.


Figures

Figure 1
Figure 1. Mice with a single ITAM sequence for all CD3 subunits exhibit major deficiencies in thymic development
(A) Rag1−/− mice reconstituted with bone marrow utilizing a single ITAM sequence for the CD3 subunits have reduced thymic cellularity (n=13–15 mice per group, 3 independent experiments, **p<0.01 and ***p<0.001). (B) Abnormal frequencies of CD4 SP, CD8SP, DN and DP thymocytes in mice expressing single CD3 ITAM sequences. Representative dot plots (left) and ratios (right) (n=13–15 mice per group, at least 3 separate experiments). Statistical Analysis was performed using two-tailed unpaired t-test. *p<0.05, **p<0.01 ***p<0.001.
Figure 2
Figure 2. CD3 ITAM diversity mediates optimal TCR expression and basal TCR signaling
(A) CD3εζ deficient Rag/ bone marrow was transduced with WT or ‘single flavor’ ITAM CD3. WT and ‘single flavor’ ITAM CD4+ single positive thymocytes TCR expression was measured. Representative histograms are shown (left). Expression is graphed as relative to the WT CD3 ITAM transduced control (on right, n=10–15 mice per group, 3 independent experiments). (B) Nur77 expression (RFI) was calculated for CD4+ (left) and CD8+ (right) SP thymocytes. Expression is graphed as relative to the WT CD3 ITAM transduced control. (n=10–13 mice per group, 3 independent experiments). (C) CD5 expression (MFI) was calculated for CD4+ (left) and CD8+ (right) SP thymocytes. Expression is graphed as relative to the WT CD3 ITAM transduced control. (n=10–13 mice per group, 3 independent experiments). RFI – Relative Fluorescent Intensity. Statistical Analysis was performed using a one-sample t-test. ***p<0.001, *p<0.05 and ns: not significant.
Figure 3
Figure 3. CD3 ITAM diversity impacts peripheral T cell and Treg development
(A) Total spleen and peripheral lymph node cell numbers were calculated for each Rag−/− mouse reconstituted with single flavor ITAMs and WT CD3 ITAM transduced bone marrow. Statistical Analysis was performed using a one-sample t-test (n=10–13 mice per group, 3 independent experiments). ***p<0.001 and **p<0.01. (B) Spleen CD4+ and CD8+ ratios and (C) Nur77 expression were calculated for each Rag−/− mouse reconstituted with single flavor ITAMs and WT CD3 ITAM transduced bone marrow. Expression is graphed as relative to the WT CD3 ITAM transduced control. Statistical Analysis was performed using a one-sample t-test (n=10–13 mice per group, 3 independent experiments). ***p<0.001, **p<0.01, *p<0.05 and ns: not significant. (D) The percentages of Foxp3+ CD4+ T cells in single flavor ITAM retrogenic mice were analyzed 5 weeks post-bone marrow transfer. Ametrine+ TCRβ+ CD4+ Foxp3+ T cells in the spleens and lymph nodes were calculated (n=12–15 in each group). Statistical Significance: *<0.05, **<0.01, and ns: not significant, two-tailed student’s t-test. (E) The proliferation of CD4+ T cells in single flavor ITAM retrogenic mice was analyzed 5 weeks post-bone marrow transfer. MACS-enriched peripheral CD4+ T cells were activated in vitro with plate-bound CD3ε (1ug/ml each) for 72 hrs. The incorporation of 3H were analyzed. Proliferation is graphed as relative to the WT CD3 ITAM transduced control. Compiled data from 5 experiments. Statistical Significant ***<0.001, One-Way ANOVA, Bonferroni’s Multiple Comparison test.

References

    1. Vrisekoop N, Monteiro JP, Mandl JN, Germain RN. Revisiting thymic positive selection and the mature T cell repertoire for antigen. Immunity. 2014;41:181–190. - PMC - PubMed
    1. Stritesky GL, Jameson SC, Hogquist KA. Selection of self-reactive T cells in the thymus. Annu Rev Immunol. 2012;30:95–114. - PMC - PubMed
    1. Guy CS, Vignali DA. Organization of proximal signal initiation at the TCR:CD3 complex. Immunological reviews. 2009;232:7–21. - PMC - PubMed
    1. Haks MC, Krimpenfort P, Borst J, Kruisbeek AM. The CD3gamma chain is essential for development of both the TCRalphabeta and TCRgammadelta lineages. EMBO J. 1998;17:1871–1882. - PMC - PubMed
    1. Kappes DJ, Tonegawa S. Surface expression of alternative forms of the TCR/CD3 complex. Proceedings of the National Academy of Sciences of the United States of America. 1991;88:10619–10623. - PMC - PubMed

Publication types

MeSH terms

Substances