. 2017 Sep:97:79-97.
doi: 10.1016/j.cogpsych.2017.07.001. Epub 2017 Jul 19.

Clear evidence for item limits in visual working memory

Affiliations

Clear evidence for item limits in visual working memory

Kirsten C S Adam et al. Cogn Psychol. 2017 Sep.

Erratum in

Abstract

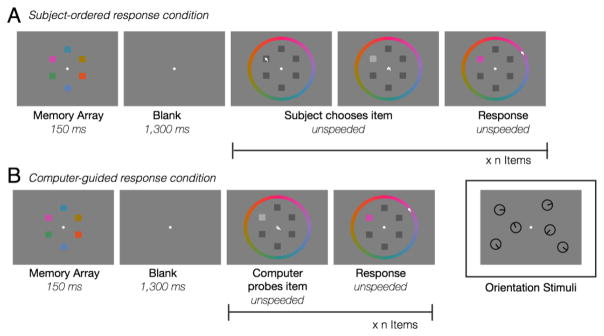
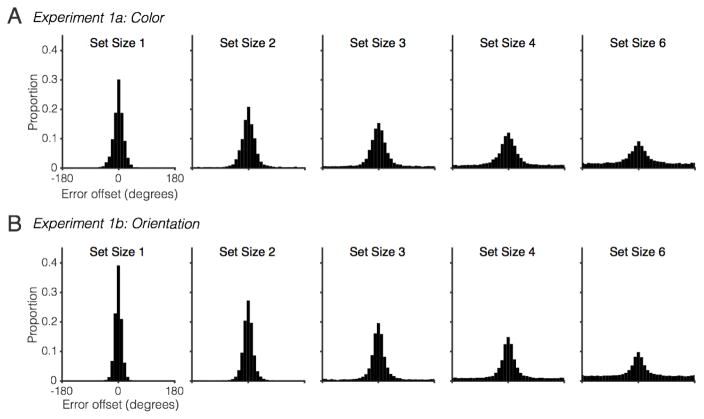
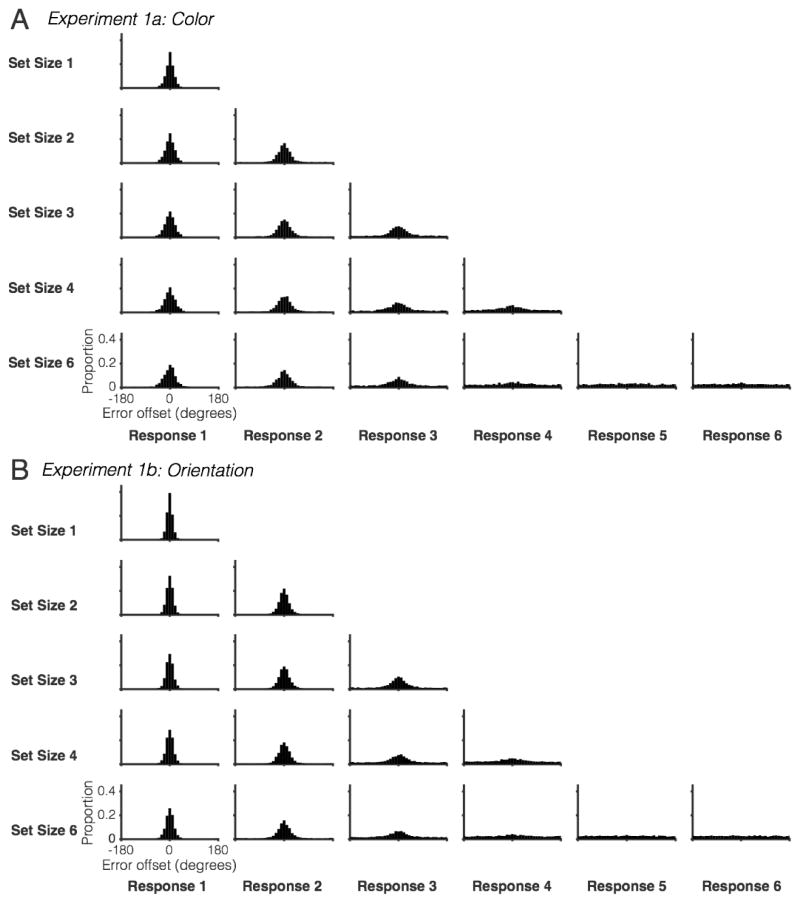
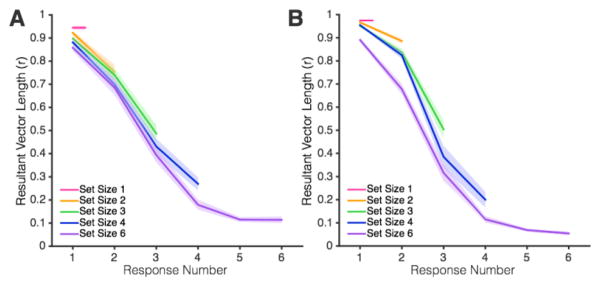
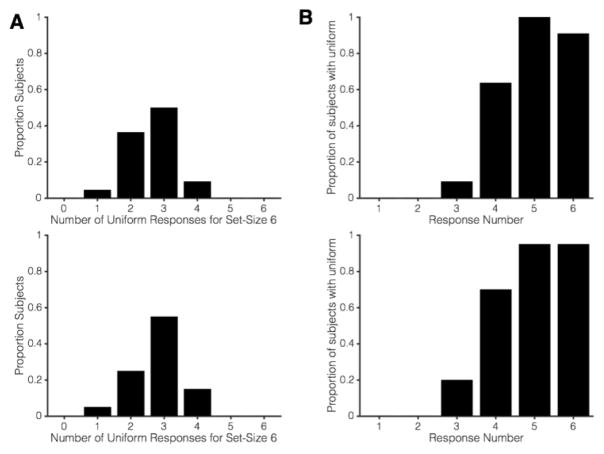
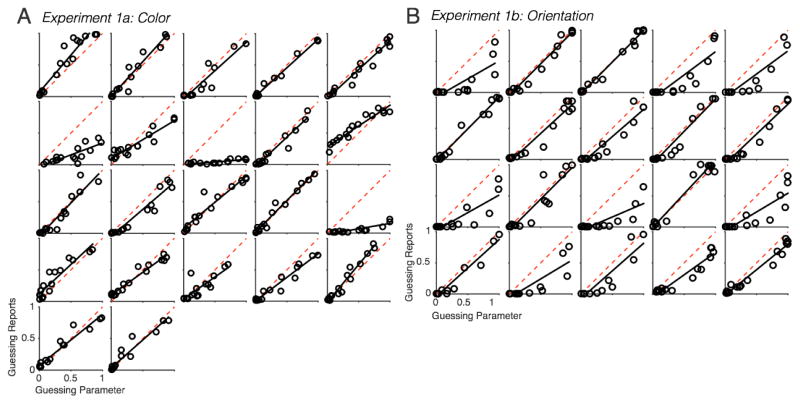
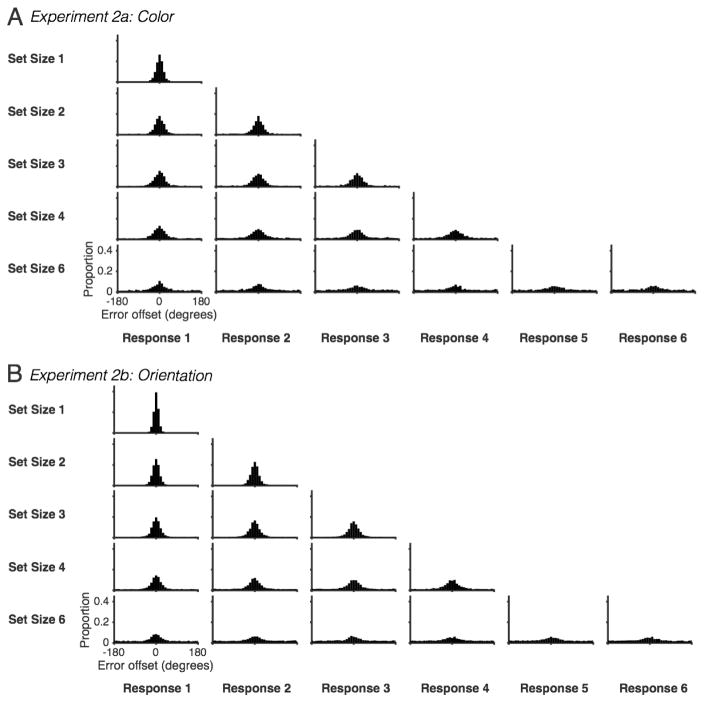
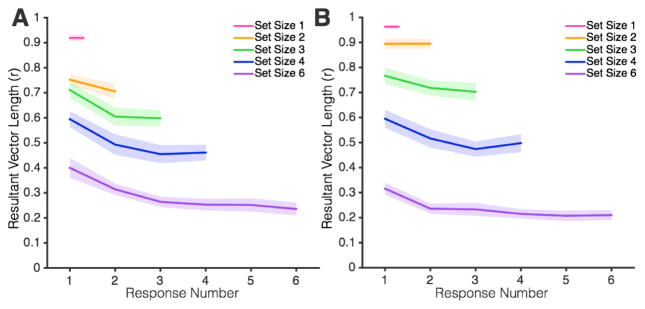
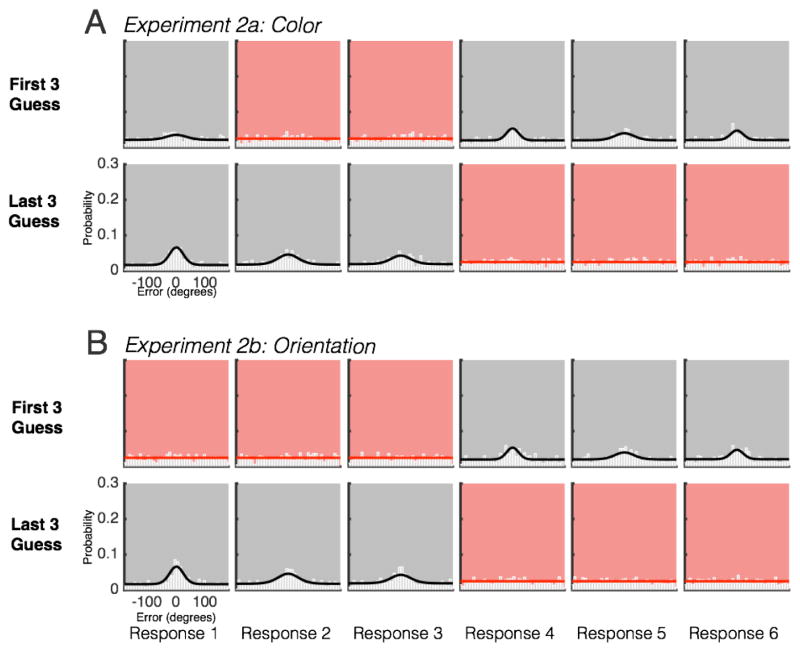
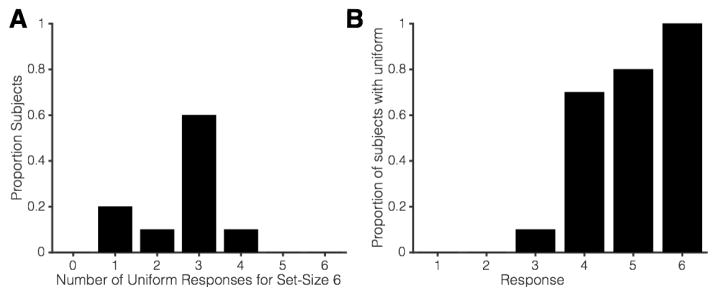
There is a consensus that visual working memory (WM) resources are sharply limited, but debate persists regarding the simple question of whether there is a limit to the total number of items that can be stored concurrently. Zhang and Luck (2008) advanced this debate with an analytic procedure that provided strong evidence for random guessing responses, but their findings can also be described by models that deny guessing while asserting a high prevalence of low precision memories. Here, we used a whole report memory procedure in which subjects reported all items in each trial and indicated whether they were guessing with each response. Critically, this procedure allowed us to measure memory performance for all items in each trial. When subjects were asked to remember 6 items, the response error distributions for about 3 out of the 6 items were best fit by a parameter-free guessing model (i.e. a uniform distribution). In addition, subjects' self-reports of guessing precisely tracked the guessing rate estimated with a mixture model. Control experiments determined that guessing behavior was not due to output interference, and that there was still a high prevalence of guessing when subjects were instructed not to guess. Our novel approach yielded evidence that guesses, not low-precision representations, best explain limitations in working memory. These guesses also corroborate a capacity-limited working memory system - we found evidence that subjects are able to report non-zero information for only 3-4 items. Thus, WM capacity is constrained by an item limit that precludes the storage of more than 3-4 individuated feature values.

Keywords: Capacity limits; Metacognition; Precision; Visual working memory.


Conflict of interest statement

Conflicts of Interest: none

Figures

Figure 1
Figure 1. Task design
Panel A depicts the order of events in Experiment 1. Panel B depicts the order of events in Experiment 2. Color stimuli were used in Experiment 1a and 2a, the orientation stimuli (inset) were used in Experiment 1b and 2b.
Figure 2
Figure 2. Aggregate data for Experiment 1
Collapsing across all responses within a set size, we see a typical decline in precision with increasing memory load.
Figure 3
Figure 3. Subject-ordered responses reveal representations that covary with response order
All set sizes and responses are shown for (A) Experiment 1a and (B) Experiment 1b.
Figure 4
Figure 4. Mean resultant vector length across responses in Experiment 1a (A) and Experiment 1b (B)
Shaded error bars represent 1 Standard Error.
Figure 5
Figure 5. Number of uniform responses for Set Size 6 in Experiments 1a and 1b
(A) Histogram of subjects’ total number of Set Size 6 responses that were best fit by a uniform distribution. Top: Color Condition; Bottom: Orientation Condition. (B) Number of subjects’ responses best fit by uniform distributions as a function of response number. Top: Color Condition; Bottom: Orientation Condition.
Figure 6
Figure 6. The relationship between behavioral guessing and modeled guessing in Experiment 1b
Each panel shows an individual’s correlation between reported guessing and the mixture model g parameter for each of 16 conditions (every response made for Set Sizes 1–4 and 6). The red dotted line represents perfect correspondence between behavioral guessing and modeled guessing (slope = 1, intercept = 0).
Figure 7
Figure 7. Computer-ordered responses reveal representations that are relatively unaffected by response order
All set sizes and responses are shown for (A) Experiment 2a and (B) Experiment 2b.
Figure 8
Figure 8. Mean resultant vector length for responses in Experiment 2a (A) and Experiment 2b (B)
Shaded error bars represent 1 Standard Error.
Figure 9
Figure 9. Response distributions for set-size 6 trials in Experiment 2, split by when participants reported guessing
Trials are binned by whether participants reported the first three responses as guesses (top row) or the final three response as guesses (bottom row) in (A) Experiment 2a and (B) Experiment 2b.
Figure 10
Figure 10. Number of uniform representations for Set Size 6 in Experiment 3
(A) Histogram of subjects’ total number of Set Size 6 responses that were best fit by a uniform distribution. (B) Number of subjects’ responses best fit by uniform distributions as a function of response number.
Figure 11
Figure 11. Cumulative distribution functions for the variable precision model across set sizes
X-axis represents the concentration parameter of the von Mises distributions pulled from the higher order gamma distribution. Y-axis represents the cumulative proportion of trials in which a given concentration (κ) or less is pulled. From left to right, the scale of the x-axis is zoomed in to better illustrate the proportion of very low precision representations that make up each higher-order distribution. Shaded error bars represent 1 Standard Error.
Figure 12
Figure 12. Illustration of von Mises distributions used by the variable precision model to account for Set Size 6 performance
Precision values of the von Mises distributions are given as both concentration (K) and standard deviation (SD) in degrees.
Figure 13
Figure 13. The minimum detectable amount of information (Kappa) needed to distinguish a von Mises distribution from uniform as a function of the number of noise-free von Mises-distributed samples
The fitted line is the linear fit of the log-transform of the sample number and the log-transform of the precision threshold.

References

    1. Adam KCS, Mance I, Fukuda K, Vogel EK. The Contribution of Attentional Lapses to Individual Differences in Visual Working Memory Capacity. Journal of Cognitive Neuroscience. 2015;27(8):1601–1616. https://doi.org/10.1162/jocn_a_00811. - DOI - PMC - PubMed
    1. Adam KCS, Vogel EK. Confident failures: Lapses of working memory reveal a metacognitive blind spot. Attention, Perception, & Psychophysics. 2017;79(5):1506–1523. - PMC - PubMed
    1. Appelle S. Perception and discrimination as a function of stimulus orientation: The “oblique effect” in man and animals. Psychological Bulletin. 1972;78(4):266–278. https://doi.org/10.1037/h0033117. - DOI - PubMed
    1. Awh E, Barton B, Vogel EK. Visual Working Memory Represents a Fixed Number of Items Regardless of Complexity. Psychological Science. 2007;18(7):622–628. https://doi.org/10.1111/j.1467-9280.2007.01949.x. - DOI - PubMed
    1. Bae GY, Olkkonen M, Allred SR, Flombaum JI. Why some colors appear more memorable than others: A model combining categories and particulars in color working memory. Journal of Experimental Psychology: General. 2015;144(4):744–763. https://doi.org/10.1037/xge0000076. - DOI - PubMed

Publication types

LinkOut - more resources