. 2017 Aug;13(8):841-849.
doi: 10.1016/j.jalz.2017.06.2266. Epub 2017 Jul 19.

Amyloid β concentrations and stable isotope labeling kinetics of human plasma specific to central nervous system amyloidosis

Affiliations

Amyloid β concentrations and stable isotope labeling kinetics of human plasma specific to central nervous system amyloidosis

Vitaliy Ovod et al. Alzheimers Dement. 2017 Aug.

Erratum in

  • Corrigendum.
    [No authors listed] [No authors listed] Alzheimers Dement. 2017 Oct;13(10):1185. doi: 10.1016/j.jalz.2017.09.004. Alzheimers Dement. 2017. PMID: 29029683 No abstract available.

Abstract

Introduction: Cerebrospinal fluid analysis and other measurements of amyloidosis, such as amyloid-binding positron emission tomography studies, are limited by cost and availability. There is a need for a more practical amyloid β (Aβ) biomarker for central nervous system amyloid deposition.

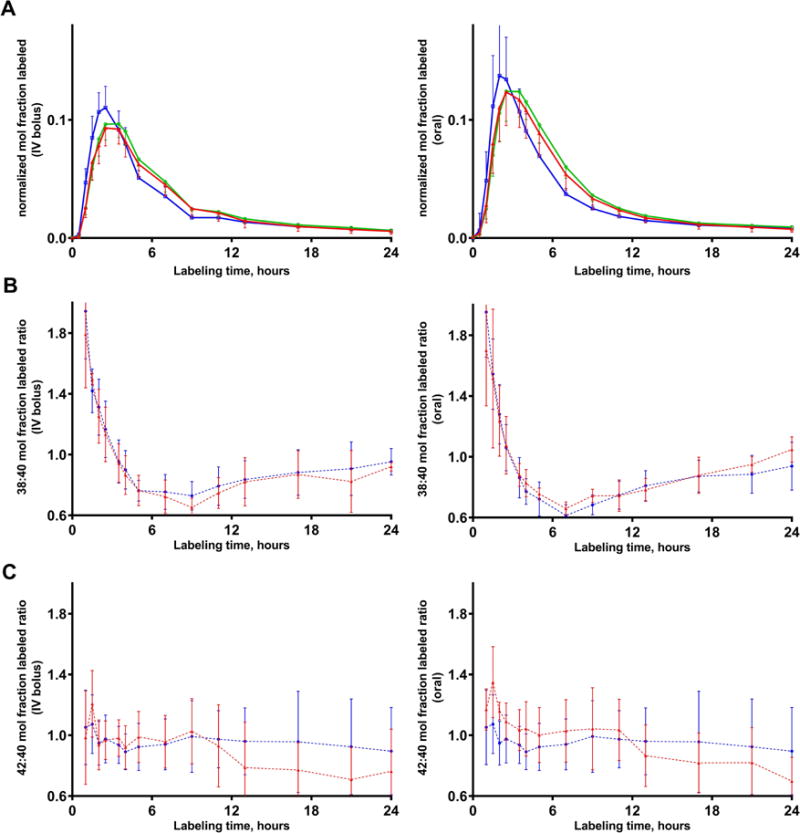
Methods: We adapted our previously reported stable isotope labeling kinetics protocol to analyze the turnover kinetics and concentrations of Aβ38, Aβ40, and Aβ42 in human plasma.

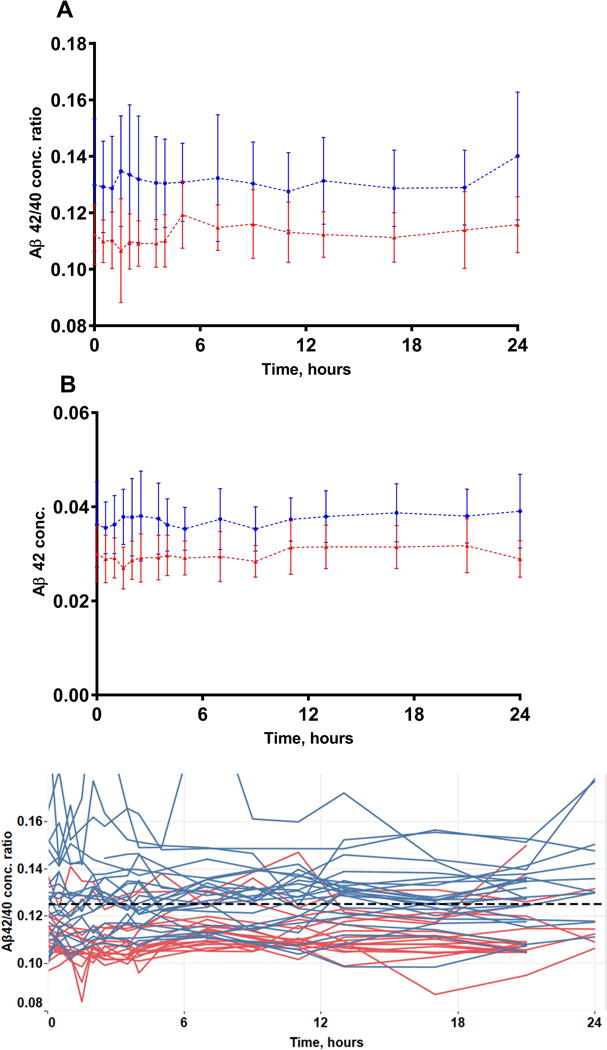
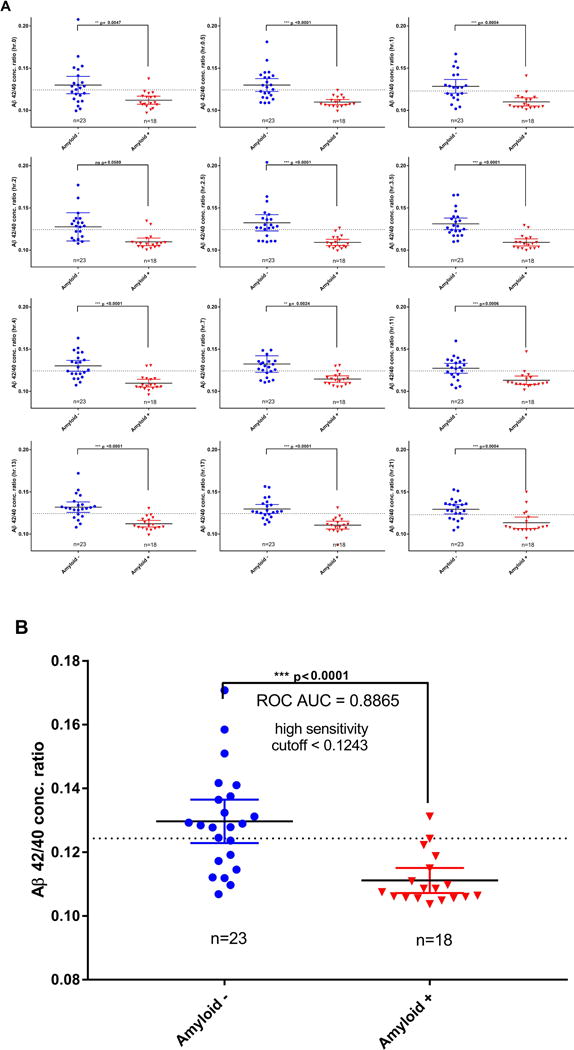
Results: Aβ isoforms have a half-life of approximately 3 hours in plasma. Aβ38 demonstrated faster turnover kinetics compared with Aβ40 and Aβ42. Faster fractional turnover of Aβ42 relative to Aβ40 and lower Aβ42 and Aβ42/Aβ40 concentrations in amyloid-positive participants were observed.

Discussion: Blood plasma Aβ42 shows similar amyloid-associated alterations as we have previously reported in cerebrospinal fluid, suggesting a blood-brain transportation mechanism of Aβ. The stability and sensitivity of plasma Aβ measurements suggest this may be a useful screening test for central nervous system amyloidosis.

Keywords: Amyloid β; Aβ42; Human; Kinetics; Plasma; Turnover.


Figures

Figure 1
Figure 1. Plasma Aβ SILK for Aβ38, Aβ40, and Aβ42
(A): Average isotopic enrichment time course profiles normalized to plasma leucine for plasma Aβ38 (blue), Aβ40 (green), and Aβ42 (red) (mean +/− 95% CI) by labeling protocol (left: IV bolus; right: oral). Kinetic profiles of all three isoforms appear similar between labeling protocols, with Aβ38 reaching its labeling peak before Aβ40 and Aβ42. (B): Average isotopic enrichment ratios for plasma Aβ38/Aβ40 displaying both amyloid groups on the same plot (blue, amyloid negative; red, amyloid positive) (mean +/− 95% CI) demonstrates similar rates of plasma Aβ38/Aβ40 turnover regardless of amyloid status or labeling protocol (left, IV bolus; right, oral). (C): Average isotopic enrichment ratios for plasma Aβ42/Aβ40 displaying both amyloid groups on the same plot (blue, amyloid negative; red, amyloid positive) highlights the faster Aβ42 turnover kinetics in the amyloid positive group (mean +/− 95% CI) for both the IV-bolus (left) and oral-labeled groups (right).
Figure 2
Figure 2. Absolute concentrations of Aβ by clinical group
(A): Absolute concentrations of Aβ42/Aβ40 over time averaged by clinical group (blue, amyloid negative; red, amyloid positive) (mean +/− 95% CI). Aβ42/Aβ40 concentrations were 10–15% lower in the amyloid positive group compared to the amyloid negative group at all time points measured. (B): Absolute concentrations of Aβ42 over time averaged by clinical group (blue, amyloid negative; red, amyloid positive) (mean +/− 95% CI). Aβ42 concentrations were 10–15% lower in the amyloid positive group compared to the amyloid negative group at all time points measured. (C): Absolute concentrations of Aβ42/Aβ40 over time with individual participant time courses illustrates the consistency of concentration measurements (blue, amyloid negative; red, amyloid positive).
Figure 3
Figure 3. Absolute concentrations of Aβ42/Aβ40 remain relatively stable over time with measurable separation of clinical groups
(A): Average Aβ42/Aβ40 concentrations for each participant at all time points separated by amyloid status (blue, amyloid negative; red, amyloid positive) demonstrate the stability and reproducibility of this measurement over time. (B): Aβ42/Aβ40 concentrations by amyloid status as an average of all time points (0 – 24 hours). On average, the Aβ42/Aβ40 concentration was 0.1297 +/− 0.0033 in the amyloid negative group (blue) and 0.1111 +/− 0.0019 in the amyloid positive group (red). This reflects a 14.3% lower Aβ42/Aβ40 concentration in amyloid positive individuals compared to amyloid negative individuals overall (p value < 0.0001, mean +/− 95% CI shown).
Figure 4
Figure 4. Plasma Aβ42/Aβ40 concentrations correlate with two different measures of amyloidosis
Plasma Aβ42/Aβ40 concentration ratios are lower in amyloid positive individuals (red) compared to amyloid negative individuals (blue) when amyloid status is determined by CSF Aβ42/Aβ40 concentrations. The relationship between decreased Aβ42/Aβ40 in both blood and CSF in the presence of amyloidosis has a correlation coefficient of 0.6999, indicating a strong positive correlation between these measurements (p < 0.0001). Similarly, plasma Aβ42/Aβ40 concentration ratios are lower in amyloid positive individuals (red) compared to amyloid negative individuals (blue) when amyloid status is determined by [11C]PIB-PET imaging with amyloid positive individuals having a mean cortical binding potential (MCBP) > 0.18. While all participants with known amyloidosis by PIB-PET had correspondingly low plasma Aβ42/Aβ40 measurements, several participants classified as amyloid negative by PIB-PET were also found to have similarly low plasma Aβ42/Aβ40 values (below the threshold of 0.1243).
Figure 5
Figure 5. ROC curve
ROC curve analysis using average plasma Aβ42/Aβ40 concentration ratios over 24 hours demonstrates an AUC of 0.8865, indicating this assay has good accuracy as a diagnostic test to detect amyloidosis.

References

    1. Selkoe DJ, Hardy J. The amyloid hypothesis of Alzheimer’s disease at 25 years. EMBO Mol Med. 2016;8(6):595–608. - PMC - PubMed
    1. Potter R, Patterson BW, Elbert DL, Ovod V, Kasten T, Sigurdson W, Mawuenyega K, Blazey T, Goate A, Chott R, Yarasheski KE, Holtzman DM, Morris JC, Benzinger TL, Bateman RJ. Increased in vivo amyloid-β42 production, exchange, and loss in presenilin mutation carriers. Sci Transl Med. 2013;5(189) - PMC - PubMed
    1. Patterson BW, Elbert DL, Mawuenyega KG, Kasten T, Ovod V, Ma S, Xiong C, Chott R, Yarasheski K, Sigurdson W, Zhang L, Goate A, Benzinger T, Morris JC, Holtzman D, Bateman RJ. Age and amyloid effects on human CNS amyloid-beta kinetics. Ann Neurol. 2015;78(3):439–453. - PMC - PubMed
    1. Beach TG, Monsell SE, Phillips LE, Kukull W. Accuracy of the clinical diagnosis of Alzheimer disease at National Institute on Aging Alzheimer’s disease Centers, 2005–2010. J Neuropathol Exp Neurol. 2013;71(4):266–273. - PMC - PubMed
    1. Cohen AD, Klunk WE. Early detection of Alzheimer’s disease using PiB and FDG PET. Neurobiol Dis. 2014;72(Pt A):117–22. - PMC - PubMed

MeSH terms