. 2017 Sep 23;390(10101):1521-1538.
doi: 10.1016/S0140-6736(17)31544-1. Epub 2017 Jul 19.

Population health and regional variations of disease burden in Japan, 1990-2015: a systematic subnational analysis for the Global Burden of Disease Study 2015

Affiliations

Population health and regional variations of disease burden in Japan, 1990-2015: a systematic subnational analysis for the Global Burden of Disease Study 2015

Shuhei Nomura et al. Lancet. .

Erratum in

  • Department of Error.
    [No authors listed] [No authors listed] Lancet. 2017 Sep 23;390(10101):1488. doi: 10.1016/S0140-6736(17)32484-4. Lancet. 2017. PMID: 28952451 Free PMC article. No abstract available.

Abstract

Background: Japan has entered the era of super-ageing and advanced health transition, which is increasingly putting pressure on the sustainability of its health system. The level and pace of this health transition might vary across regions within Japan and concern is growing about increasing regional variations in disease burden. The Global Burden of Diseases, Injuries, and Risk Factors Study 2015 (GBD 2015) provides a comprehensive, comparable framework. We used data from GBD 2015 with the aim to quantify the burden of disease and injuries, and to attribute risk factors in Japan at a subnational, prefecture-level.

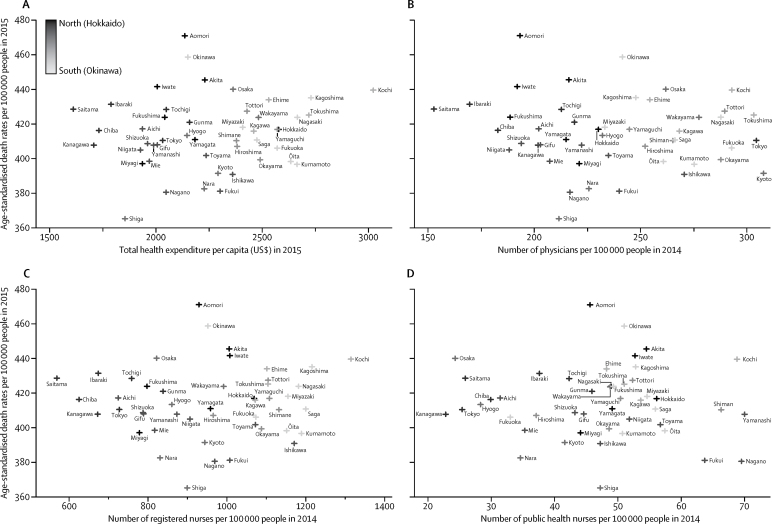
Methods: We used data from GBD 2015 for 315 causes and 79 risk factors of death, disease, and injury incidence and prevalence to measure the burden of diseases and injuries in Japan and in the 47 Japanese prefectures from 1990 to 2015. We extracted data from GBD 2015 to assess mortality, causes of death, years of life lost (YLLs), years lived with disability (YLDs), disability-adjusted life-years (DALYs), life expectancy, and healthy life expectancy (HALE) in Japan and its 47 prefectures. We split extracted data by prefecture and applied GBD methods to generate estimates of burden, and attributable burden due to known risk factors. We examined the prefecture-level relationships of common health system inputs (eg, health expenditure and workforces) to the GBD outputs in 2015 to address underlying determinants of regional health variations.

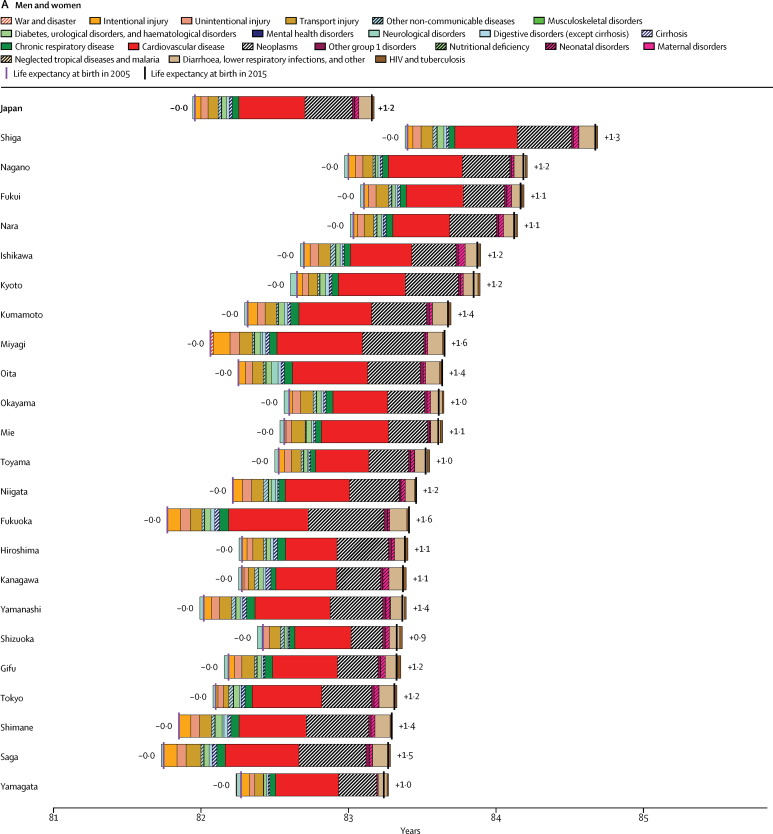
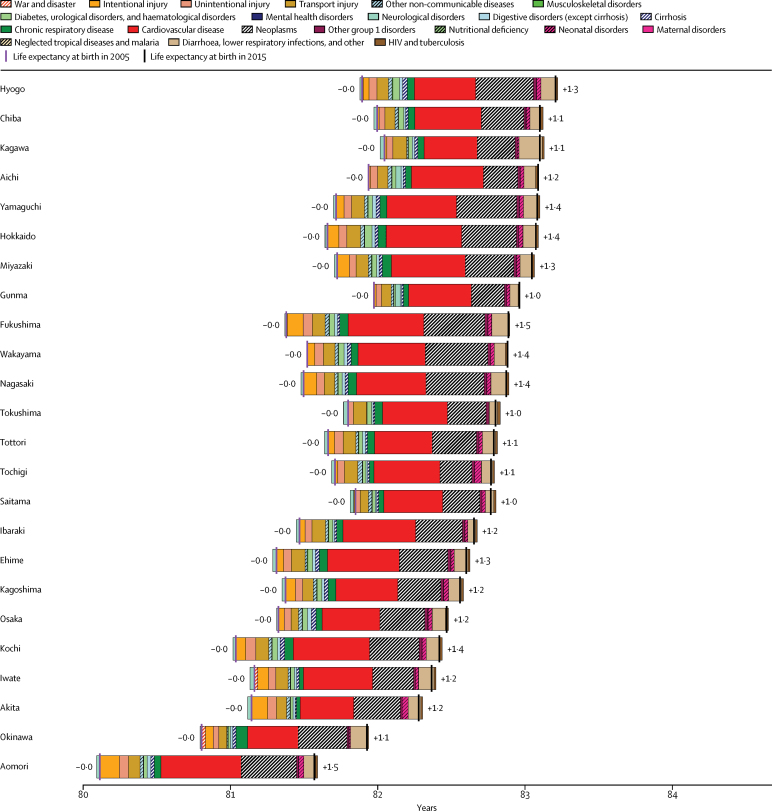
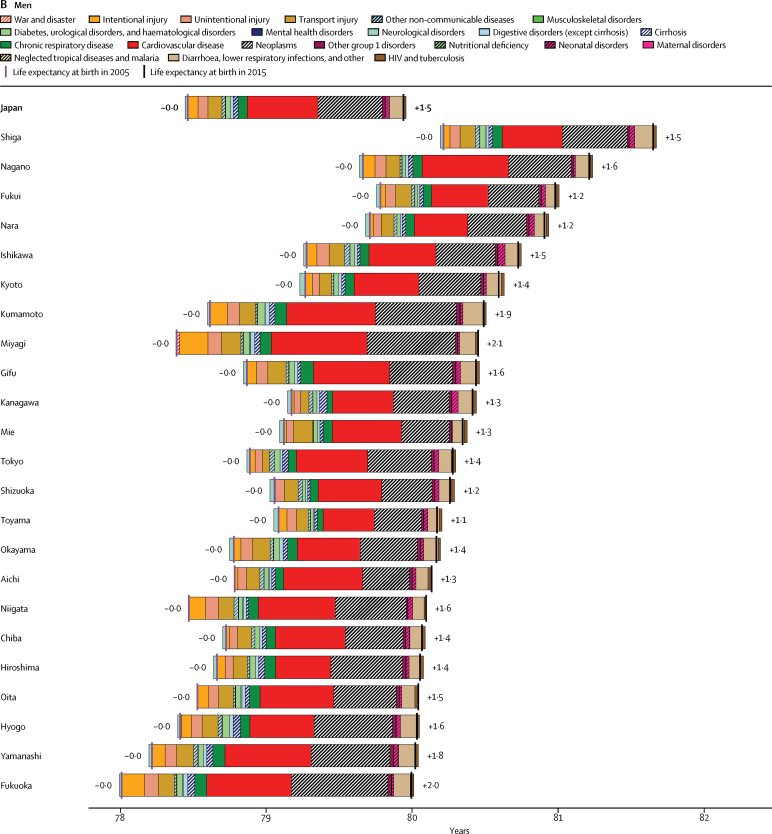
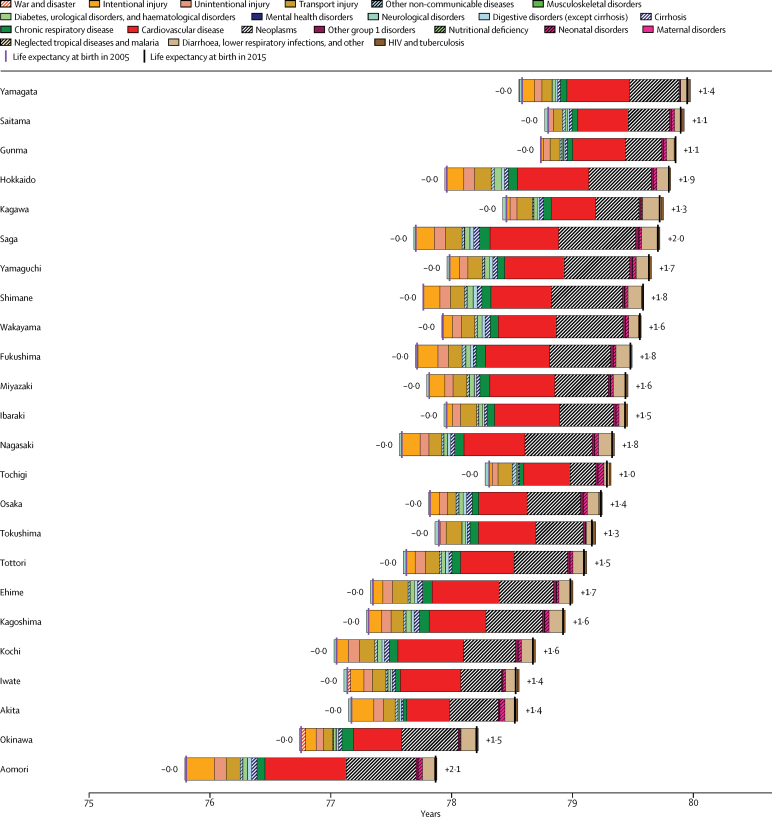
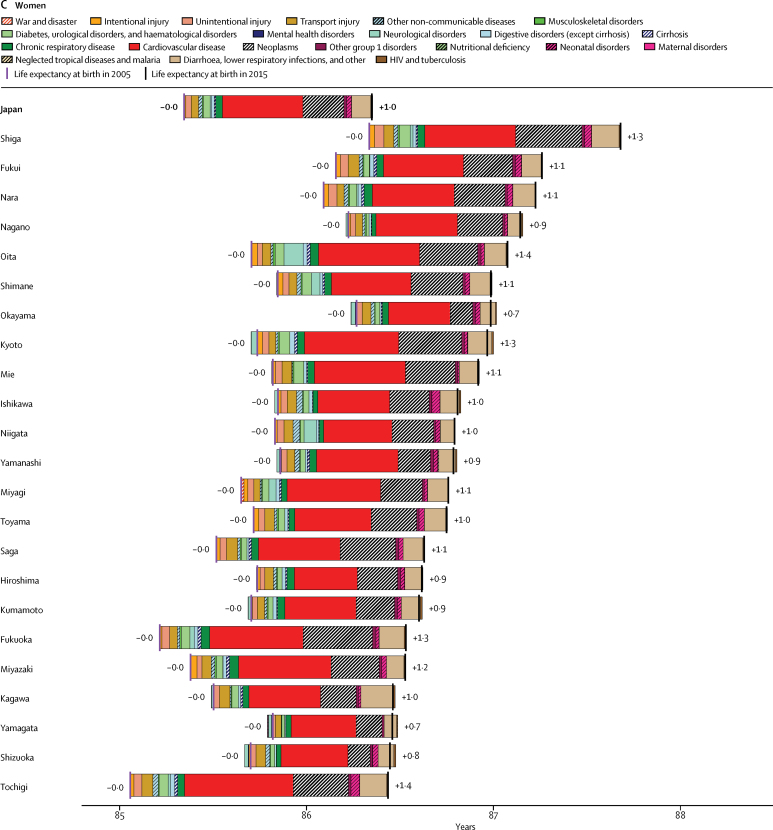
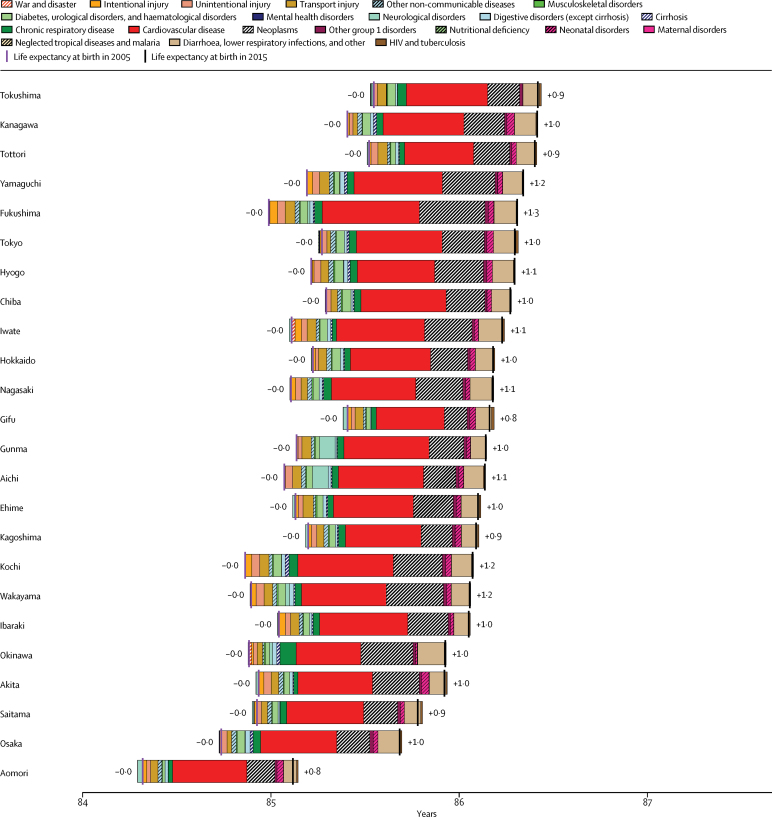
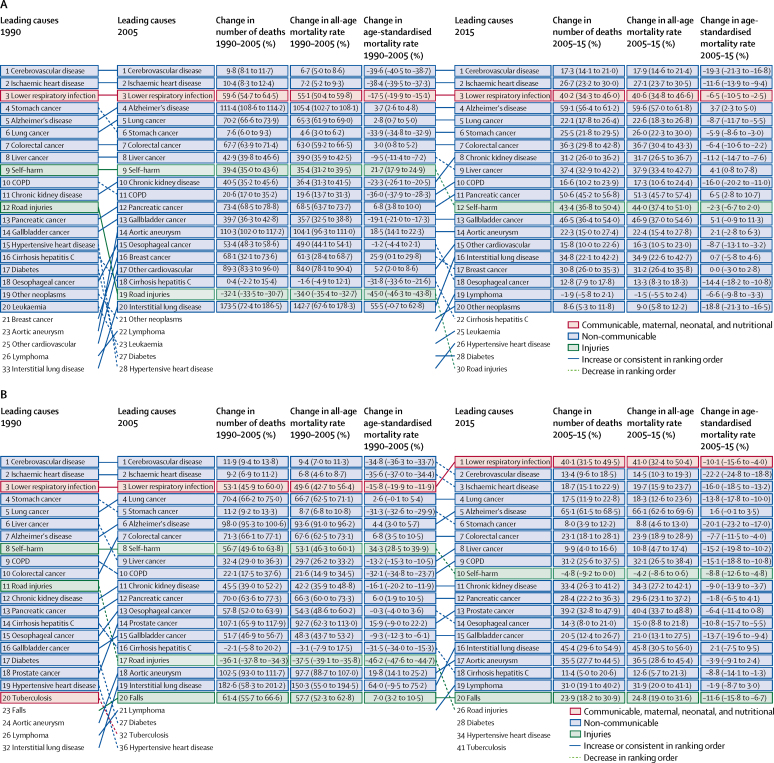
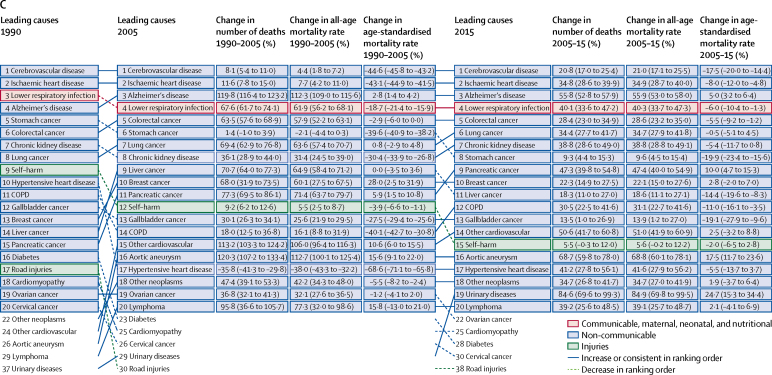
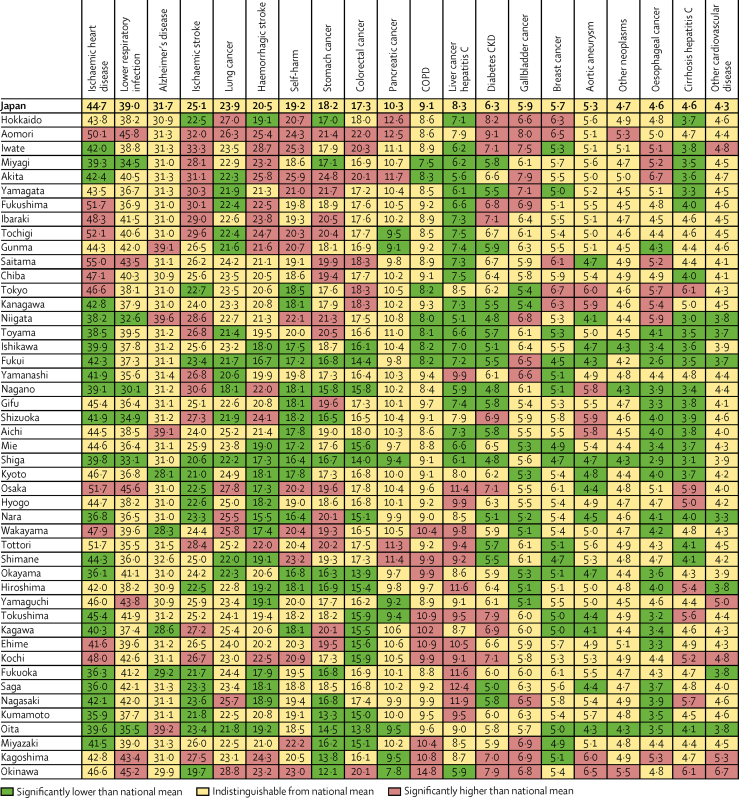
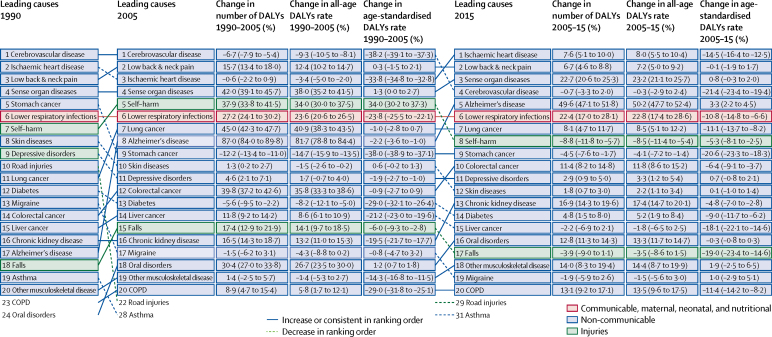
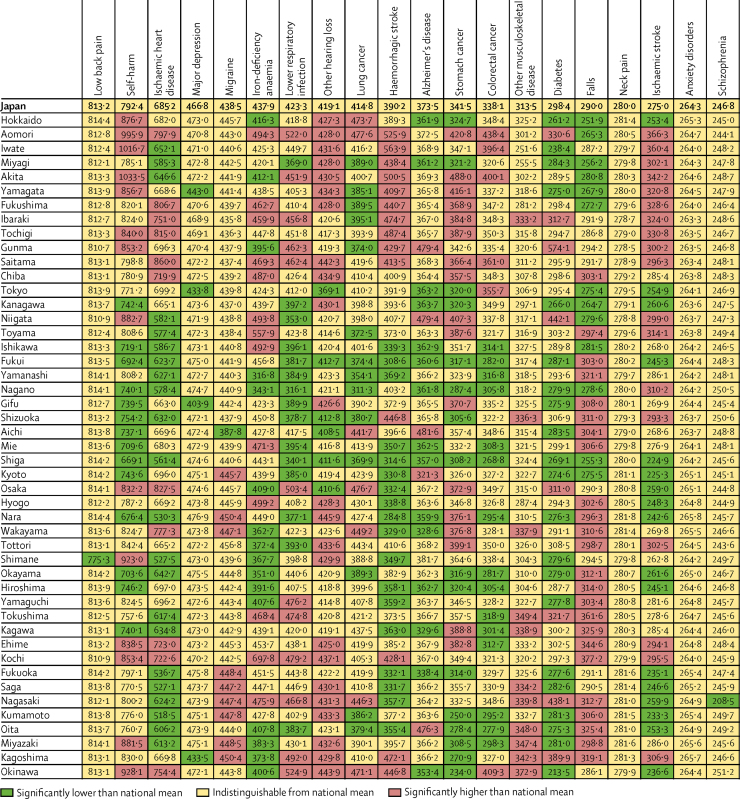
Findings: Life expectancy at birth in Japan increased by 4·2 years from 79·0 years (95% uncertainty interval [UI] 79·0 to 79·0) to 83·2 years (83·1 to 83·2) between 1990 and 2015. However, the gaps between prefectures with the lowest and highest life expectancies and HALE have widened, from 2·5 to 3·1 years and from 2·3 to 2·7 years, respectively, from 1990 to 2015. Although overall age-standardised death rates decreased by 29·0% (28·7 to 29·3) from 1990 to 2015, the rates of mortality decline in this period substantially varied across the prefectures, ranging from -32·4% (-34·8 to -30·0) to -22·0% (-20·4 to -20·1). During the same time period, the rate of age-standardised DALYs was reduced overall by 19·8% (17·9 to 22·0). The reduction in rates of age-standardised YLDs was very small by 3·5% (2·6 to 4·3). The pace of reduction in mortality and DALYs in many leading causes has largely levelled off since 2005. Known risk factors accounted for 34·5% (32·4 to 36·9) of DALYs; the two leading behavioural risk factors were unhealthy diets and tobacco smoking in 2015. The common health system inputs were not associated with age-standardised death and DALY rates in 2015.

Interpretation: Japan has been successful overall in reducing mortality and disability from most major diseases. However, progress has slowed down and health variations between prefectures is growing. In view of the limited association between the prefecture-level health system inputs and health outcomes, the potential sources of regional variations, including subnational health system performance, urgently need assessment.

Funding: Bill & Melinda Gates Foundation, Japan Ministry of Education, Science, Sports and Culture, Japan Ministry of Health, Labour and Welfare, AXA CR Fixed Income Fund and AXA Research Fund.


Figures

Figure 1
Figure 1
Life expectancy at birth in Japan and the 47 prefectures in 2015 and its change from 2005 to 2015 decomposed into the contribution of GBD level 2 cause group for (A) both sexes combined, (B) men, and (C) women Causes to the left of the 2005 life expectancy values reflect causes that contributed to reduced life expectancy between 2005 and 2015. Causes to the right of the 2005 life expectancy values reflect causes that contributed to increased life expectancy between 2005 and 2015. GBD=Global Burden of Diseases, Injuries, and Risk Factors.
Figure 1
Figure 1
Life expectancy at birth in Japan and the 47 prefectures in 2015 and its change from 2005 to 2015 decomposed into the contribution of GBD level 2 cause group for (A) both sexes combined, (B) men, and (C) women Causes to the left of the 2005 life expectancy values reflect causes that contributed to reduced life expectancy between 2005 and 2015. Causes to the right of the 2005 life expectancy values reflect causes that contributed to increased life expectancy between 2005 and 2015. GBD=Global Burden of Diseases, Injuries, and Risk Factors.
Figure 2
Figure 2
GBD level 3 causes of death in Japan in 1990, 2005, and 2015 for (A) both sexes combined, (B) men, and (C) women, with all-age and age-standardised death rate change Ranking is based on the number of deaths from each cause. Percentage change in number of deaths and in all-age and age-standardised death rates are shown with 95% UI in parentheses. Alzheimer's disease=Alzheimer's disease and other dementias. Cirrhosis hepatitis C=cirrhosis of the liver due to hepatitis C. COPD=chronic obstructive pulmonary disease. GBD=Global Burden of Diseases, Injuries, and Risk Factors.
Figure 2
Figure 2
GBD level 3 causes of death in Japan in 1990, 2005, and 2015 for (A) both sexes combined, (B) men, and (C) women, with all-age and age-standardised death rate change Ranking is based on the number of deaths from each cause. Percentage change in number of deaths and in all-age and age-standardised death rates are shown with 95% UI in parentheses. Alzheimer's disease=Alzheimer's disease and other dementias. Cirrhosis hepatitis C=cirrhosis of the liver due to hepatitis C. COPD=chronic obstructive pulmonary disease. GBD=Global Burden of Diseases, Injuries, and Risk Factors.
Figure 3
Figure 3
Age-standardised rates (per 100 000) of mortality by GBD level 4 cause group for Japan and the 47 prefectures in 2015 for both sexes combined Japan and prefectures are ordered from north (Hokkaido) to south (Okinawa). The causes shown are the top 20 age-standardised rates of mortality in Japan. Rates are colour-coded to denote statistically significant differences from Japan's national mean. Significance set at p<0·05. Alzheimer's disease=Alzheimer's disease and other dementias. COPD=chronic obstructive pulmonary disease. Liver cancer hepatitis C=liver cancer due to hepatitis C. Cirrhosis hepatitis C=cirrhosis of the liver due to hepatitis C. GBD=Global Burden of Diseases, Injuries, and Risk Factors.
Figure 4
Figure 4
GBD level 3 causes of DALYs in Japan in 1990, 2005, and 2015 for both sexes combined, with all-age and age-standardised DALY rate change Ranking is based on the number of DALYs from each cause. Percentage change in number of DALYs and in all-age and age-standardised DALY rates are shown with 95% UI in parentheses. Alzheimer's disease=Alzheimer's disease and other dementias. COPD=chronic obstructive pulmonary disease. DALYs=disability-adjusted life-years. GBD=Global Burden of Diseases, Injuries, and Risk Factors.
Figure 5
Figure 5
Age-standardised rates (per 100 000) of DALYs by GBD level 4 cause group for Japan and the 47 prefectures in 2015 for both sexes combined Japan and prefectures are ordered from north (Hokkaido) to south (Okinawa). The causes shown are the top 20 age-standardised DALYs rates in Japan. Rates are colour-coded to denote statistically significant differences from Japan's national mean. Significance set at p<0·05. Alzheimer's disease=Alzheimer's disease and other dementias. DALYs=disability-adjusted life-years. GBD=Global Burden of Diseases, Injuries, and Risk Factors. Other hearing loss=age-related and other hearing loss.
Figure 6
Figure 6
Association between age-standardised death rates and (A) total health expenditure per capita, (B) number of physicians, (C) registered nurses, and (D) public health nurses per 100 000 people A gradation of symbols refers to the dark to light (black to white) from north (Hokkaido) to south (Okinawa). We defined the total health expenditure as the sum of inpatient and outpatient expenditures (not including those on dental care). In presenting results, we used the exchange rate of 112 Japanese yen per US$ as of Feb 3, 2017.

Comment in

  • Health inequality across prefectures in Japan.
    Kanchanachitra C, Tangcharoensathien V. Kanchanachitra C, et al. Lancet. 2017 Sep 23;390(10101):1471-1473. doi: 10.1016/S0140-6736(17)31792-0. Epub 2017 Jul 19. Lancet. 2017. PMID: 28734671 No abstract available.

References

    1. Ministry of Health. Labour and Welfare Overview of vital statistics in 2015. 2016. http://www.mhlw.go.jp/toukei/saikin/hw/jinkou/kakutei15/index.html (accessed April 20, 2017).
    1. Statistics Bureau Population estimates by age (5-Year Age Group) and sex. 2016. http://www.stat.go.jp/english/data/jinsui/tsuki/index.htm (accessed April 20, 2017).
    1. OECD . OECD Factbook: Economic, Environmental and Social Statistics. 2015–2016. Organisation for Economic, Co-operation Development; Paris: 2016.
    1. Statistics Bureau Chapter 2 Population and Households. 2017. http://www.stat.go.jp/english/data/nenkan/66nenkan/14310-2.htm (accessed April 20, 2017).
    1. Ikegami N, Yoo BK, Hashimoto H. Japanese universal health coverage: evolution, achievements, and challenges. Lancet. 2011;378:1106–1115. - PubMed