

Multifaceted C-X-C Chemokine Receptor 4 (CXCR4) Inhibition Interferes with Anti-Vascular Endothelial Growth Factor Therapy-Induced Glioma Dissemination
- PMID: 28734730
- PMCID: PMC5809520
- DOI: 10.1016/j.ajpath.2017.04.020
Multifaceted C-X-C Chemokine Receptor 4 (CXCR4) Inhibition Interferes with Anti-Vascular Endothelial Growth Factor Therapy-Induced Glioma Dissemination
Erratum in
-
Correction.Am J Pathol. 2017 Nov;187(11):2617. doi: 10.1016/j.ajpath.2017.09.001. Am J Pathol. 2017. PMID: 29073969 Free PMC article. No abstract available.
Abstract
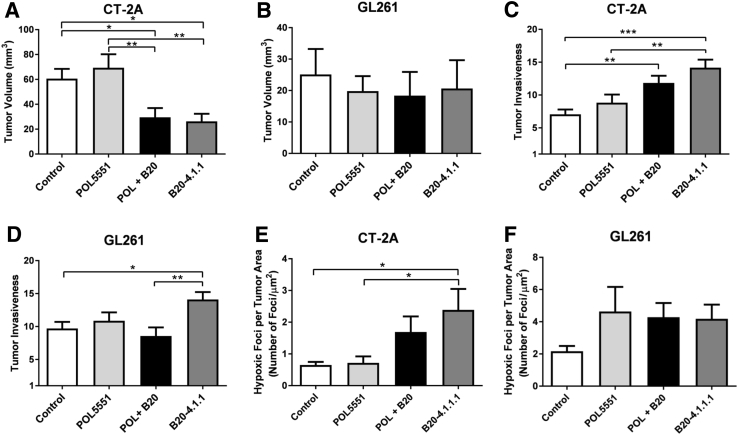
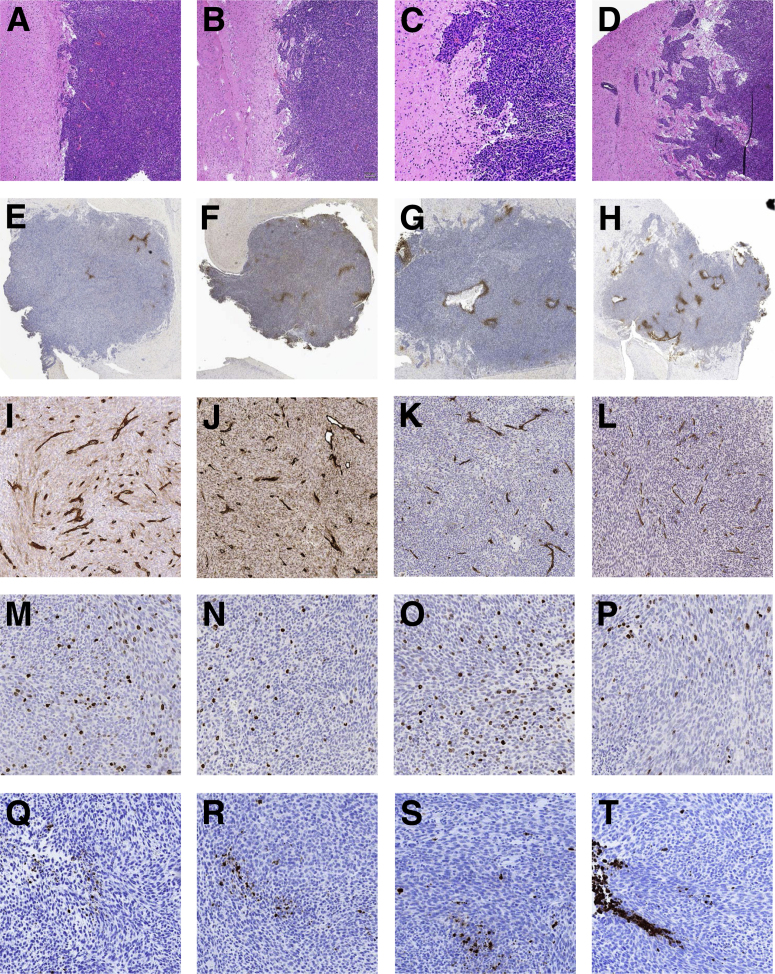
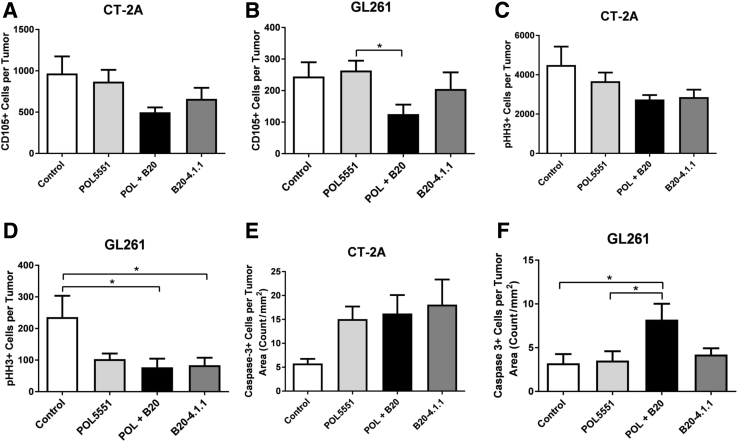
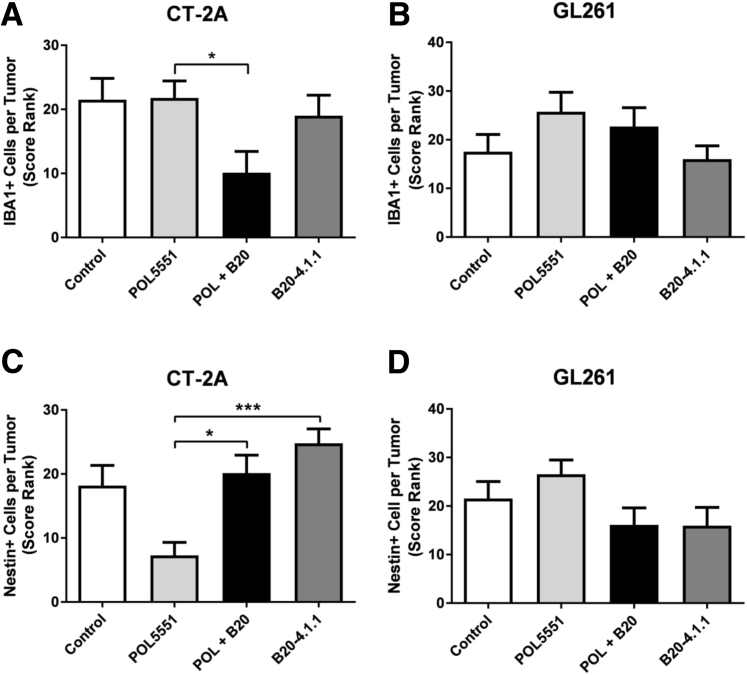
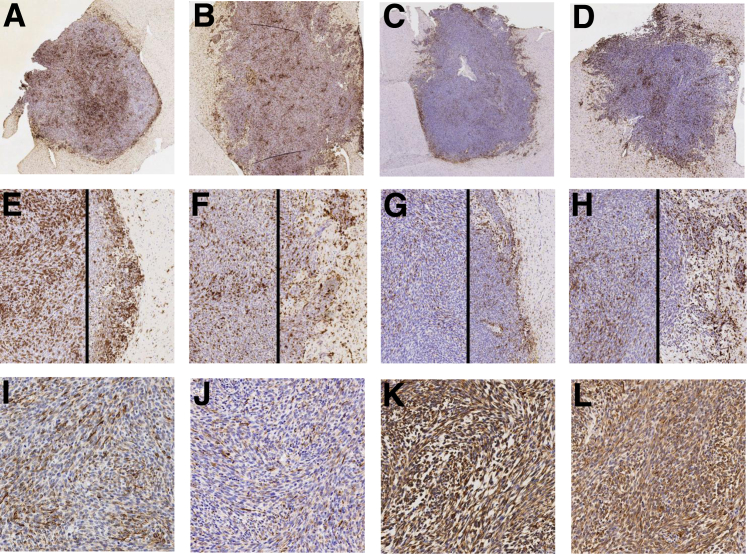
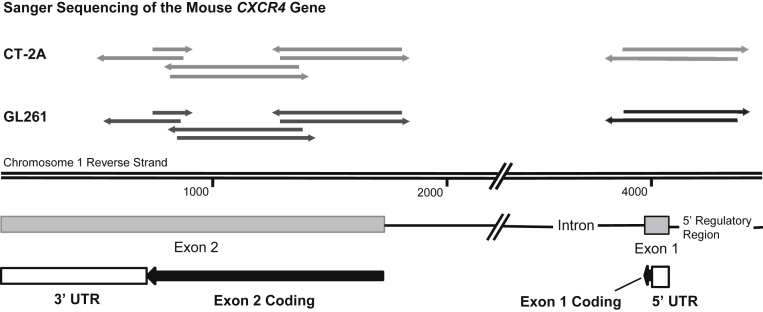
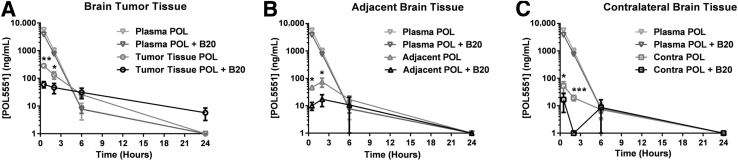
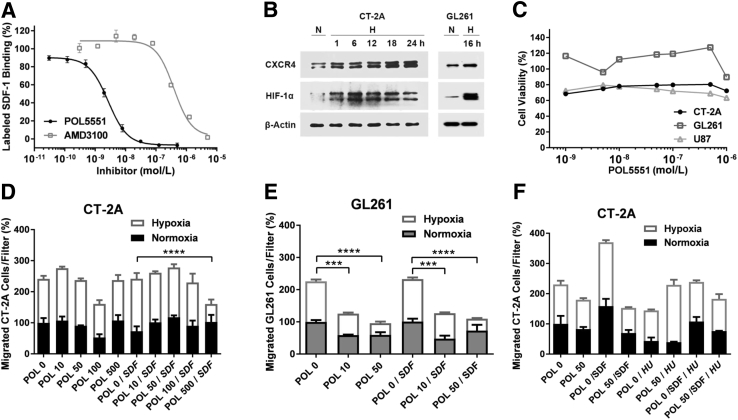
Resistance to antiangiogenic therapy in glioblastoma (GBM) patients may involve hypoxia-induced expression of C-X-C motif chemokine receptor 4 (CXCR4) on invading tumor cells, macrophage/microglial cells (MGCs), and glioma stem cells (GSCs). We determined whether antagonizing CXCR4 with POL5551 disrupts anti-vascular endothelial growth factor (VEGF) therapy-induced glioma growth and dissemination. Mice bearing orthotopic CT-2A or GL261 gliomas received POL5551 and/or anti-VEGF antibody B20-4.1.1. Brain tissue was analyzed for tumor volume, invasiveness, hypoxia, vascular density, proliferation, apoptosis, GSCs, and MGCs. Glioma cells were evaluated for CXCR4 expression and polymorphism and POL5551's effects on CXCR4 ligand binding, cell viability, and migration. No CXCR4 mutations were identified. POL5551 inhibited CXCR4 binding to its ligand, stromal cell-derived factor-1α, and reduced hypoxia- and stromal cell-derived factor-1α-mediated migration dose-dependently but minimally affected cell viability. In vivo, B20-4.1.1 increased hypoxic foci and invasiveness, as seen in GBM patients receiving anti-VEGF therapy. Combination of POL5551 and B20-4.1.1 reduced both glioma invasiveness by 16% to 39% and vascular density compared to B20-4.1.1 alone in both glioma models. Reduced populations of GSCs and MGCs were also seen in CT-2A tumors. POL5551 concentrations, evaluated by mass spectrometry, were higher in tumors than in neighboring brain tissues, likely accounting for the results. Inhibition of CXCR4-regulated tumoral, stem cell, and immune mechanisms by adjunctive CXCR4 antagonists may help overcome antiangiogenic therapy resistance, benefiting GBM patients.
Copyright © 2017 American Society for Investigative Pathology. Published by Elsevier Inc. All rights reserved.
Figures
Similar articles
-
The chemokine CXCL12 and its receptor CXCR4 promote glioma stem cell-mediated VEGF production and tumour angiogenesis via PI3K/AKT signalling.J Pathol. 2011 Jul;224(3):344-54. doi: 10.1002/path.2908. Epub 2011 May 27. J Pathol. 2011. PMID: 21618540
-
Hypoxia-inducible factor 1 and VEGF upregulate CXCR4 in glioblastoma: implications for angiogenesis and glioma cell invasion.Lab Invest. 2006 Dec;86(12):1221-32. doi: 10.1038/labinvest.3700482. Epub 2006 Oct 30. Lab Invest. 2006. PMID: 17075581
-
Proteasome inhibition with bortezomib induces cell death in GBM stem-like cells and temozolomide-resistant glioma cell lines, but stimulates GBM stem-like cells' VEGF production and angiogenesis.J Neurosurg. 2013 Dec;119(6):1415-23. doi: 10.3171/2013.7.JNS1323. Epub 2013 Oct 4. J Neurosurg. 2013. PMID: 24093630 Free PMC article.
-
Antiangiogenic therapy in malignant glioma: promise and challenge.Curr Pharm Des. 2007;13(35):3545-58. doi: 10.2174/138161207782794130. Curr Pharm Des. 2007. PMID: 18220791 Review.
-
Patterns of progression in malignant glioma following anti-VEGF therapy: perceptions and evidence.Curr Neurol Neurosci Rep. 2011 Jun;11(3):305-12. doi: 10.1007/s11910-011-0184-0. Curr Neurol Neurosci Rep. 2011. PMID: 21279815 Review.
Cited by
-
Understanding the Significance of Hypoxia-Inducible Factors (HIFs) in Glioblastoma: A Systematic Review.Cancers (Basel). 2024 May 30;16(11):2089. doi: 10.3390/cancers16112089. Cancers (Basel). 2024. PMID: 38893207 Free PMC article. Review.
-
Pro- and Antiangiogenic Factors in Gliomas: Implications for Novel Therapeutic Possibilities.Int J Mol Sci. 2021 Jun 7;22(11):6126. doi: 10.3390/ijms22116126. Int J Mol Sci. 2021. PMID: 34200145 Free PMC article. Review.
-
Glioma stem cells and their roles within the hypoxic tumor microenvironment.Theranostics. 2021 Jan 1;11(2):665-683. doi: 10.7150/thno.41692. eCollection 2021. Theranostics. 2021. PMID: 33391498 Free PMC article. Review.
-
The Role of the CXCL12/CXCR4/CXCR7 Chemokine Axis in Cancer.Front Pharmacol. 2020 Dec 8;11:574667. doi: 10.3389/fphar.2020.574667. eCollection 2020. Front Pharmacol. 2020. PMID: 33363463 Free PMC article. Review.
-
Effect of bevacizumab combined with chemotherapy on SDF-1 and CXCR4 in epithelial ovarian cancer and its prognosis.World J Surg Oncol. 2022 May 11;20(1):154. doi: 10.1186/s12957-022-02621-2. World J Surg Oncol. 2022. PMID: 35545781 Free PMC article. Clinical Trial.
References
-
- van Beijnum J.R., Nowak-Sliwinska P., Huijbers E.J., Thijssen V.L., Griffioen A.W. The great escape: the hallmarks of resistance to antiangiogenic therapy. Pharmacol Rev. 2015;67:441–461. - PubMed
-
- Gagner J.P., Golfinos J.G., Graber J.J., Zagzag D. Molecular basis of glioma neovascularization and its therapeutic applications. In: Mehta M., Chang S., Newton H., Guha A., Vogelbaum M., editors. Principles and Practice of Neuro-Oncology: A Multidisciplinary Approach. Demos Medical Publishing; New York: 2011. pp. 122–144. i5–i7.
MeSH terms
Substances
Grants and funding
LinkOut - more resources
Full Text Sources
Other Literature Sources
