

Plaque Rupture in Coronary Atherosclerosis Is Associated With Increased Plaque Structural Stress
- PMID: 28734911
- PMCID: PMC5725311
- DOI: 10.1016/j.jcmg.2017.04.017
Plaque Rupture in Coronary Atherosclerosis Is Associated With Increased Plaque Structural Stress
Abstract
Objectives: The aim of this study was to identify the determinants of plaque structural stress (PSS) and the relationship between PSS and plaques with rupture.
Background: Plaque rupture is the most common cause of myocardial infarction, occurring particularly in higher risk lesions such as fibroatheromas. However, prospective intravascular ultrasound-virtual histology studies indicate that <10% higher risk plaques cause clinical events over 3 years, indicating that other factors also determine plaque rupture. Plaque rupture occurs when PSS exceeds its mechanical strength; however, the determinants of PSS and its association with plaques with proven rupture are not known.
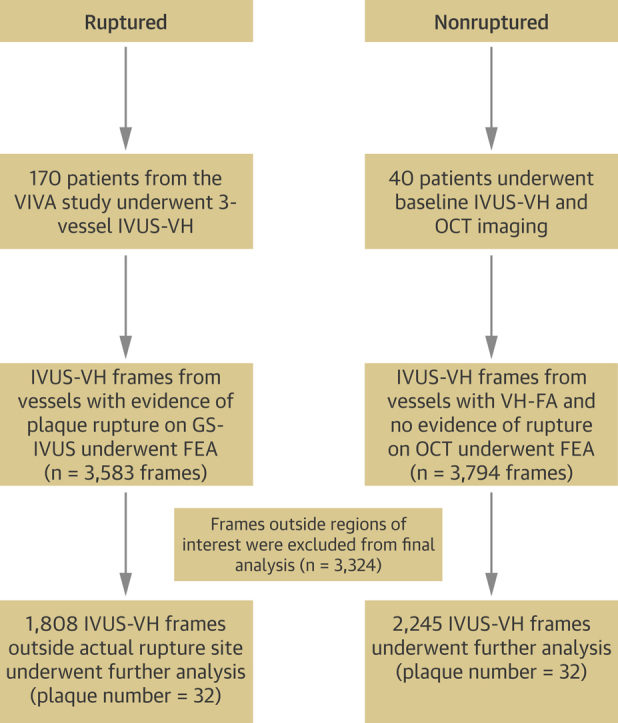
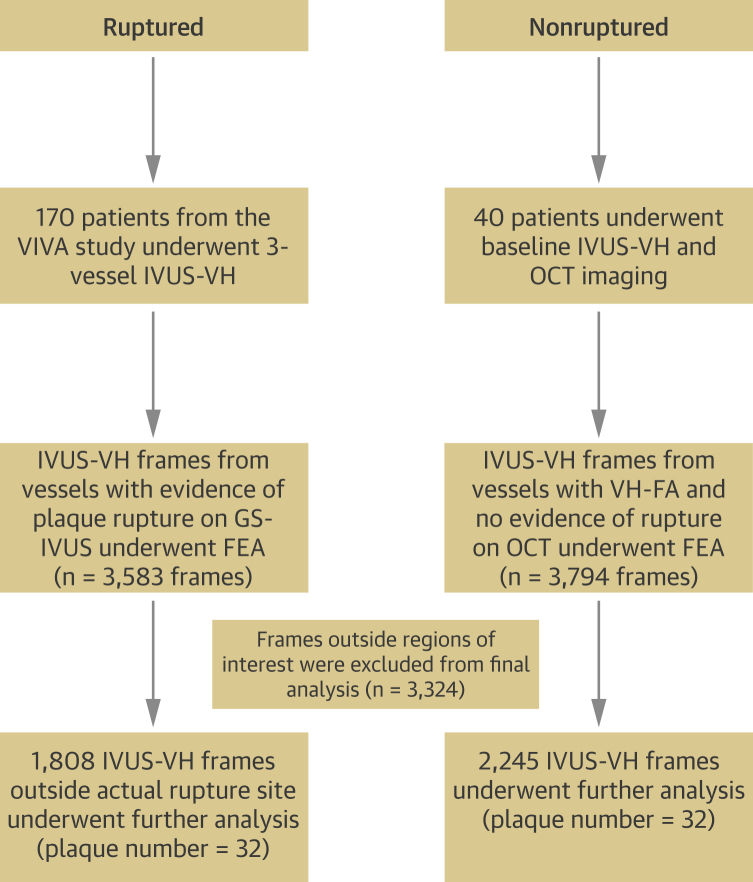
Methods: We analyzed plaque structure and composition in 4,053 virtual histology intravascular ultrasound frames from 32 fibroatheromas with rupture from the intravascular ultrasound-virtual histology in Vulnerable Atherosclerosis study and 32 fibroatheromas without rupture on optical coherence tomography from a stable angina cohort. Mechanical loading in the periluminal region was estimated by calculating maximum principal PSS by finite element analysis.
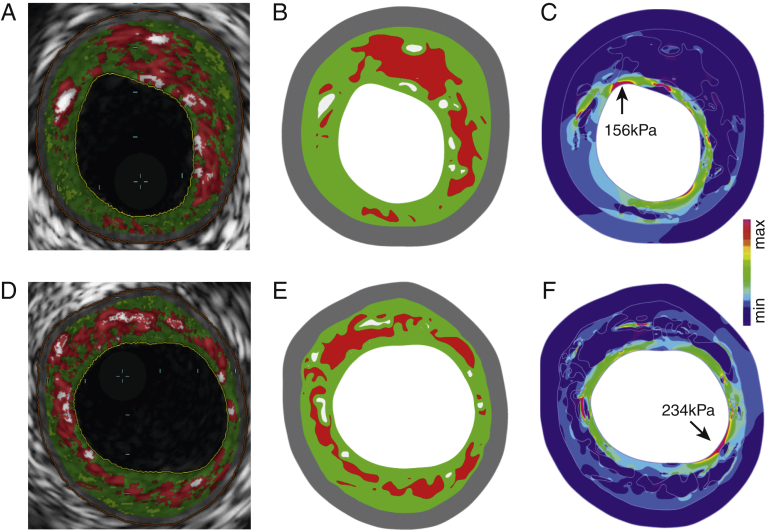
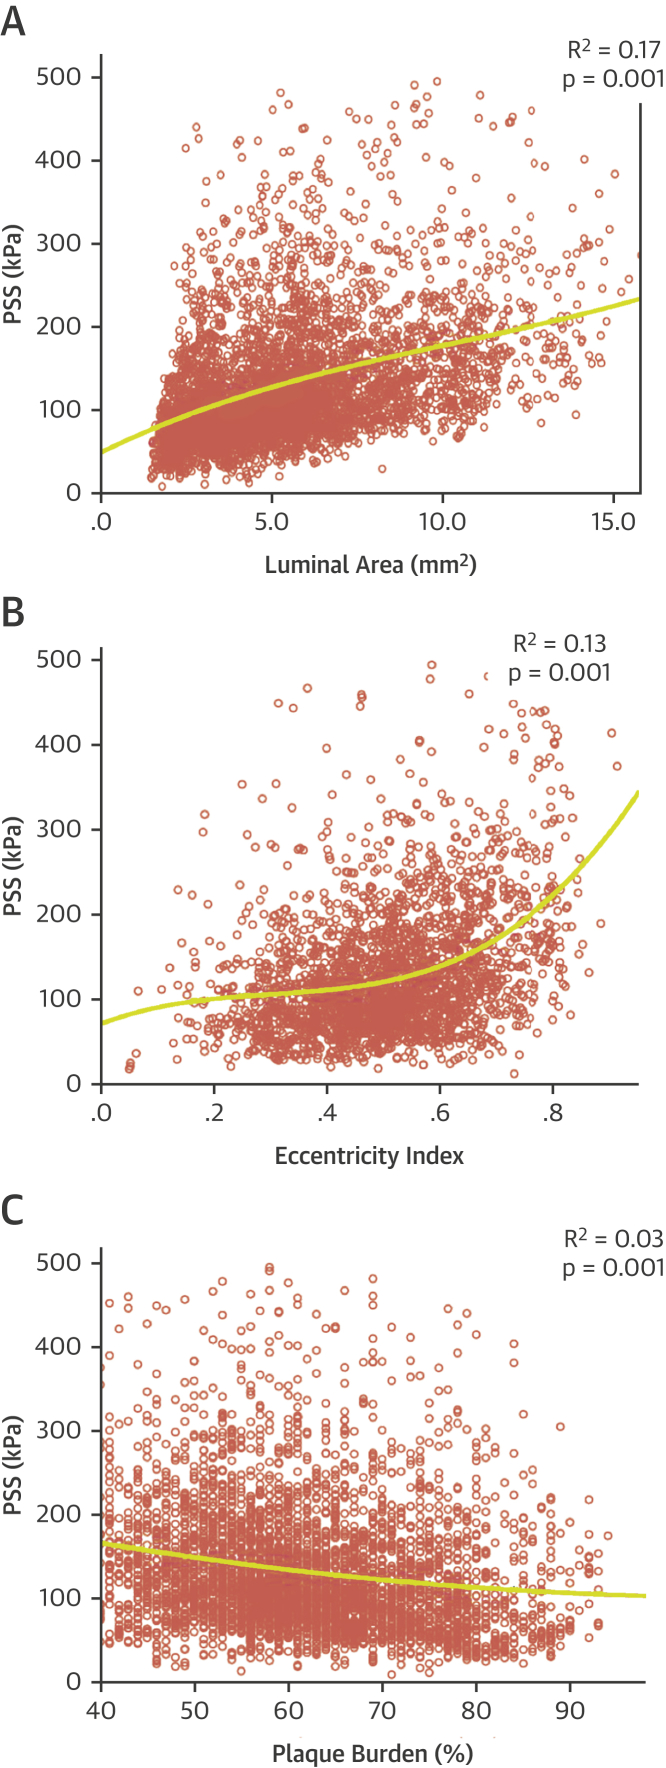
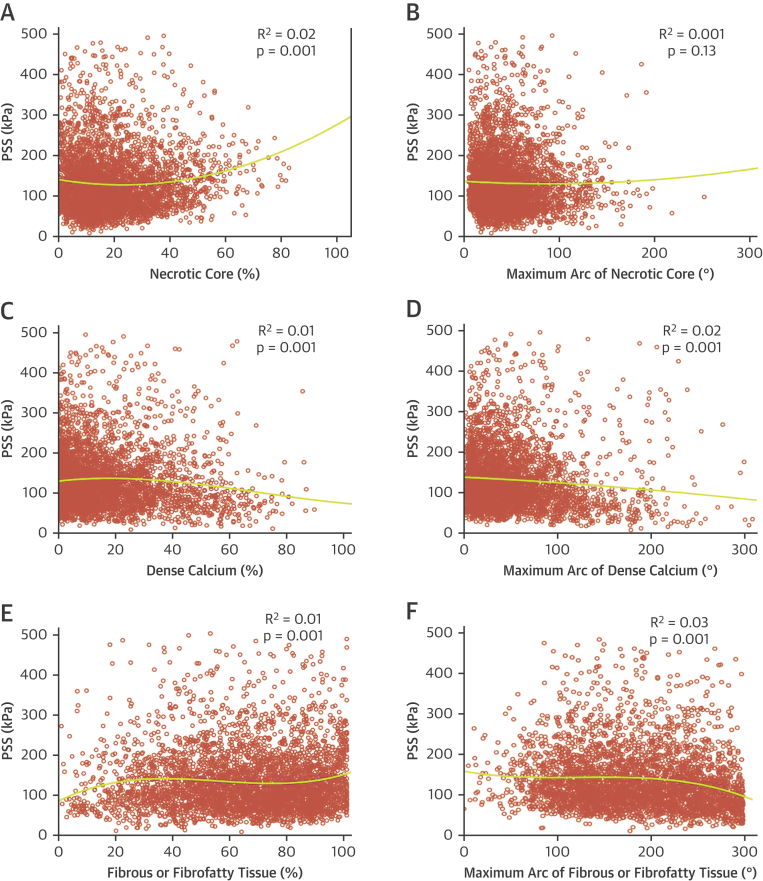
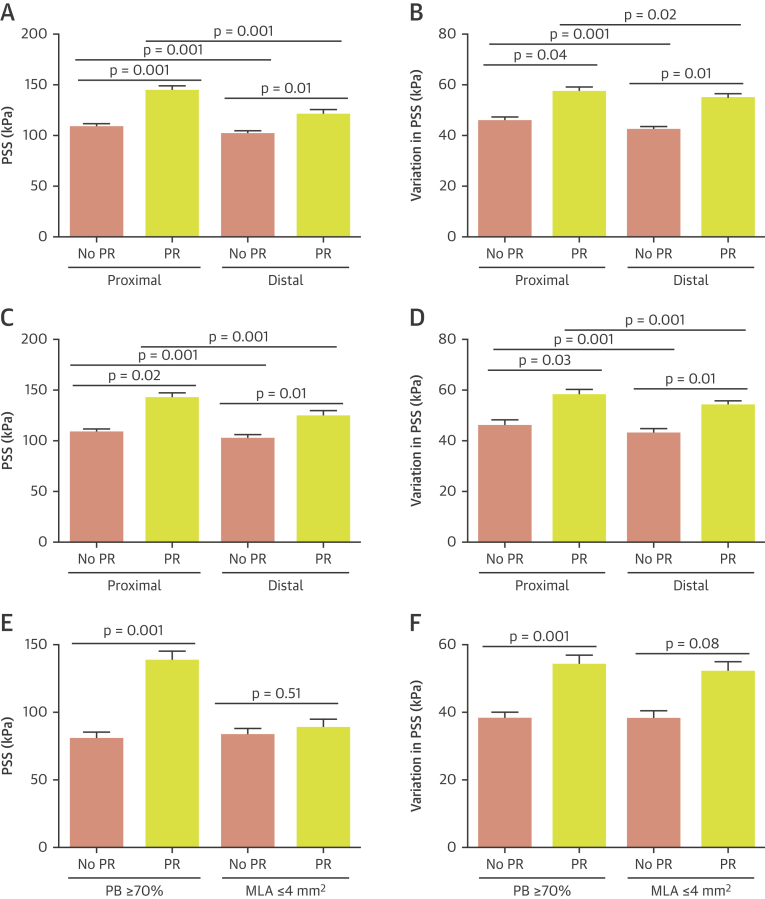
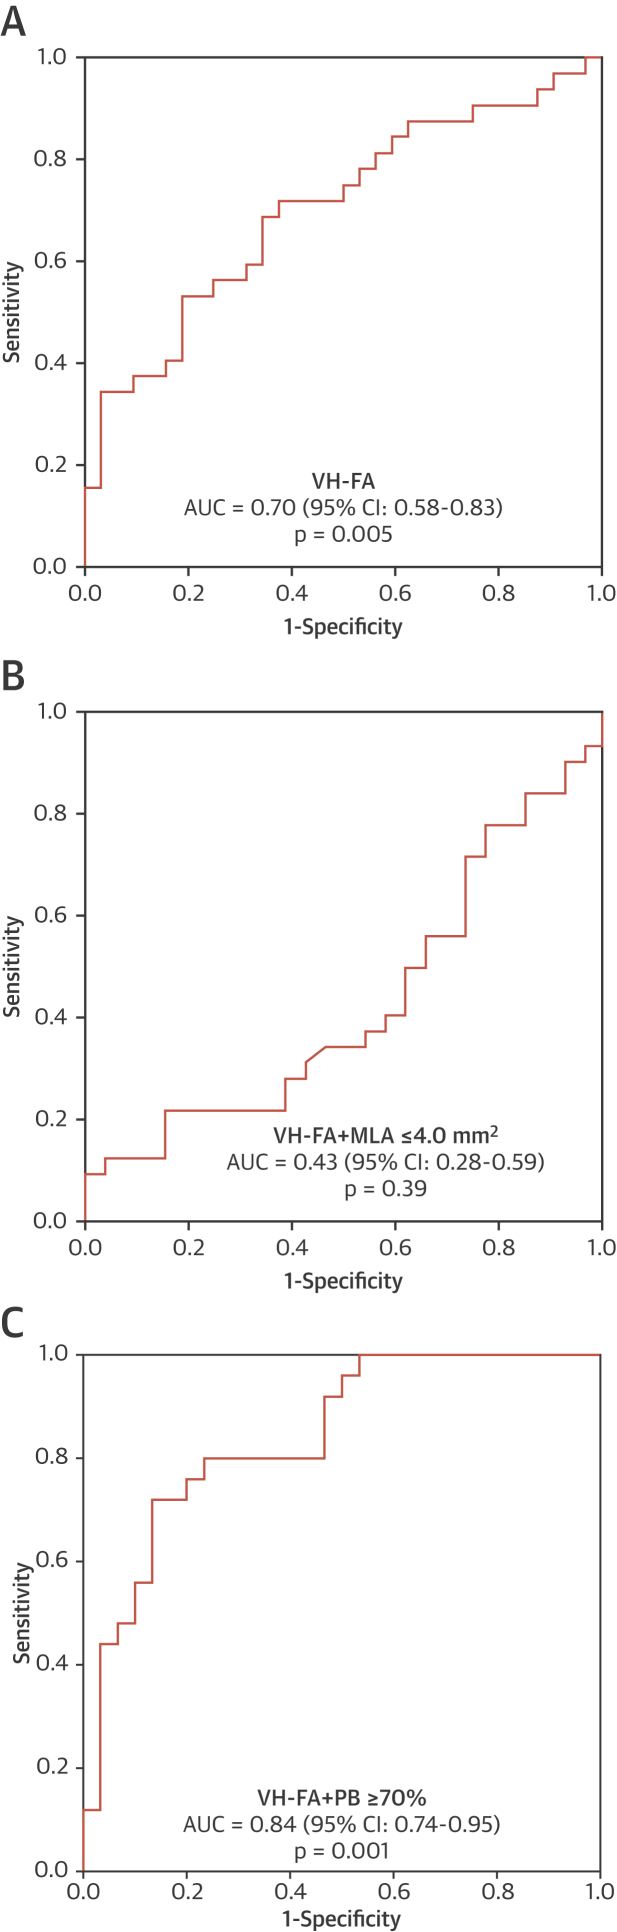
Results: PSS increased with increasing lumen area (r = 0.46; p = 0.001), lumen eccentricity (r = 0.32; p = 0.001), and necrotic core ≥10% (r = 0.12; p = 0.001), but reduced when dense calcium was ≥10% (r = -0.12; p = 0.001). Ruptured fibroatheromas showed higher PSS (133 kPa [quartiles 1 to 3: 90 to 191 kPa] vs. 104 kPa [quartiles 1 to 3: 75 to 142 kPa]; p = 0.002) and variation in PSS (55 kPa [quartiles 1 to 3: 37 to 75 kPa] vs. 43 kPa [quartiles 1 to 3: 34 to 59 kPa]; p = 0.002) than nonruptured fibroatheromas, with rupture primarily occurring either proximal or immediately adjacent to the minimal luminal area (87.5% vs. 12.5%; p = 0.001). PSS was higher in segments proximal to the rupture site (143 kPa [quartiles 1 to 3: 101 to 200 kPa] vs. 120 kPa [quartiles 1 to 3: 78 to 180 kPa]; p = 0.001) versus distal segments, associated with increased necrotic core (19.1% [quartiles 1 to 3: 11% to 29%] vs. 14.3% [quartiles 1 to 3: 8% to 23%]; p = 0.001) but reduced fibrous/fibrofatty tissue (63.6% [quartiles 1 to 3: 46% to 78%] vs. 72.7% [quartiles 1 to 3: 54% to 86%]; p = 0.001). PSS >135 kPa was a good predictor of rupture in higher risk regions.
Conclusions: PSS is determined by plaque composition, plaque architecture, and lumen geometry. PSS and PSS variability are increased in plaques with rupture, particularly at proximal segments. Incorporating PSS into plaque assessment may improve identification of rupture-prone plaques.
Keywords: atherosclerosis; coronary disease; vulnerable plaque.
Copyright © 2017 The Authors. Published by Elsevier Inc. All rights reserved.
Figures
Comment in
-
The Ongoing Quest to Predict Plaque Rupture.JACC Cardiovasc Imaging. 2017 Dec;10(12):1484-1486. doi: 10.1016/j.jcmg.2017.02.024. Epub 2017 Jul 19. JACC Cardiovasc Imaging. 2017. PMID: 28734914 No abstract available.
Similar articles
-
Heterogeneity of Plaque Structural Stress Is Increased in Plaques Leading to MACE: Insights From the PROSPECT Study.JACC Cardiovasc Imaging. 2020 May;13(5):1206-1218. doi: 10.1016/j.jcmg.2019.05.024. Epub 2019 Jul 17. JACC Cardiovasc Imaging. 2020. PMID: 31326476 Free PMC article.
-
Coronary plaque structural stress is associated with plaque composition and subtype and higher in acute coronary syndrome: the BEACON I (Biomechanical Evaluation of Atheromatous Coronary Arteries) study.Circ Cardiovasc Imaging. 2014 May;7(3):461-70. doi: 10.1161/CIRCIMAGING.113.001526. Epub 2014 Feb 20. Circ Cardiovasc Imaging. 2014. PMID: 24557858
-
Plaque Structural Stress Estimations Improve Prediction of Future Major Adverse Cardiovascular Events After Intracoronary Imaging.Circ Cardiovasc Imaging. 2016 Jun;9(6):e004172. doi: 10.1161/CIRCIMAGING.115.004172. Circ Cardiovasc Imaging. 2016. PMID: 27307548
-
Intravascular ultrasound and optical coherence tomography imaging of coronary atherosclerosis.Int J Cardiovasc Imaging. 2016 Jan;32(1):189-200. doi: 10.1007/s10554-015-0701-3. Epub 2015 Jul 8. Int J Cardiovasc Imaging. 2016. PMID: 26153522 Review.
-
What have we learned about plaque rupture in acute coronary syndromes?Curr Cardiol Rep. 2010 Jul;12(4):338-43. doi: 10.1007/s11886-010-0113-x. Curr Cardiol Rep. 2010. PMID: 20425160 Review.
Cited by
-
Age-related wall shear stress changes assessed by vascular vector flow mapping in the carotid arteries of healthy adults: a cross-sectional study.Cardiovasc Diagn Ther. 2024 Aug 31;14(4):668-678. doi: 10.21037/cdt-24-134. Epub 2024 Aug 16. Cardiovasc Diagn Ther. 2024. PMID: 39263489 Free PMC article.
-
Vulnerable Plaque, Characteristics, Detection, and Potential Therapies.J Cardiovasc Dev Dis. 2019 Jul 27;6(3):26. doi: 10.3390/jcdd6030026. J Cardiovasc Dev Dis. 2019. PMID: 31357630 Free PMC article. Review.
-
Sex differences in features of atherosclerotic plaques as revealed by various imaging techniques: historical review.Front Physiol. 2025 May 26;16:1579885. doi: 10.3389/fphys.2025.1579885. eCollection 2025. Front Physiol. 2025. PMID: 40491450 Free PMC article. Review.
-
Intracoronary Imaging: Current Practice and Future Perspectives.Rev Cardiovasc Med. 2023 Feb 2;24(2):39. doi: 10.31083/j.rcm2402039. eCollection 2023 Feb. Rev Cardiovasc Med. 2023. PMID: 39077408 Free PMC article. Review.
-
Coronary Physiology-Based Approaches for Plaque Vulnerability: Implications for Risk Prediction and Treatment Strategies.Korean Circ J. 2023 Sep;53(9):581-593. doi: 10.4070/kcj.2023.0117. Korean Circ J. 2023. PMID: 37653694 Free PMC article. Review.
References
-
- Davies M.J., Thomas A. Thrombosis and acute coronary-artery lesions in sudden cardiac ischemic death. N Engl J Med. 1984;310:1137–1140. - PubMed
-
- Virmani R., Burke A.P., Kolodgie F.D., Farb A. Pathology of the thin-cap fibroatheroma: a type of vulnerable plaque. J Interv Cardiol. 2003;16:267–272. - PubMed
-
- Calvert P.A., Obaid D.R., O'Sullivan M. Association between IVUS findings and adverse outcomes in patients with coronary artery disease: the VIVA (VH-IVUS in Vulnerable Atherosclerosis) Study. J Am Coll Cardiol Img. 2011;4:894–901. - PubMed
-
- Stone G.W., Maehara A., Lansky A.J. A prospective natural-history study of coronary atherosclerosis. N Engl J Med. 2011;364:226–235. - PubMed
-
- Richardson P.D., Davies M.J., Born G.V. Influence of plaque configuration and stress distribution on fissuring of coronary atherosclerotic plaques. Lancet. 1989;2:941–944. - PubMed
Publication types
MeSH terms
Grants and funding
LinkOut - more resources
Full Text Sources
Other Literature Sources
Medical
