. 2017 Aug 2;95(3):683-696.e11.
doi: 10.1016/j.neuron.2017.06.042. Epub 2017 Jul 20.

Behaviorally Selective Engagement of Short-Latency Effector Pathways by Motor Cortex

Affiliations

Behaviorally Selective Engagement of Short-Latency Effector Pathways by Motor Cortex

Andrew Miri et al. Neuron. .

Abstract

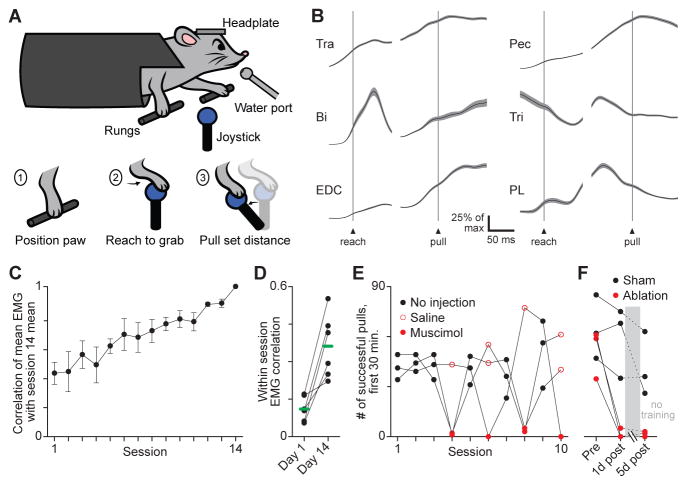
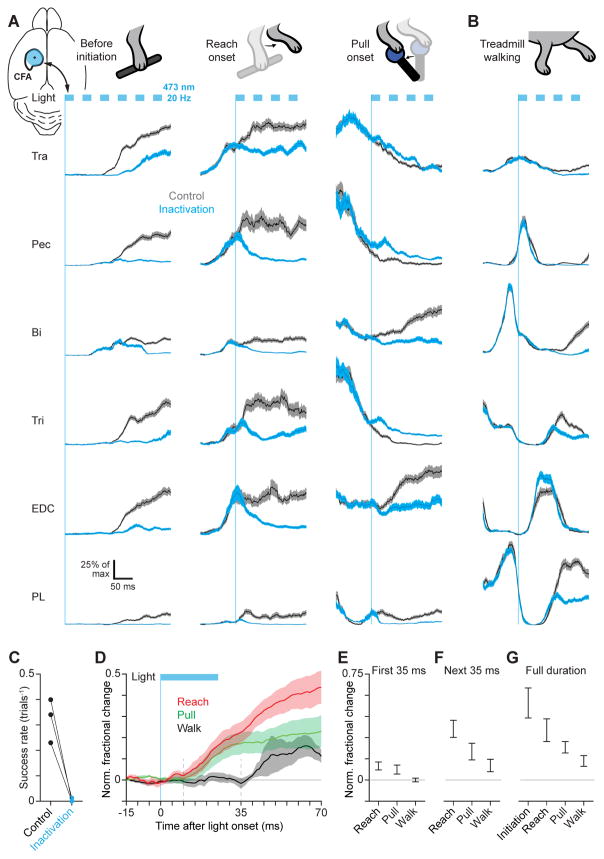
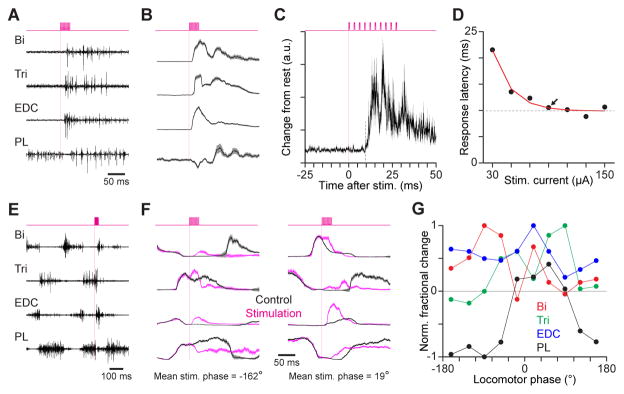
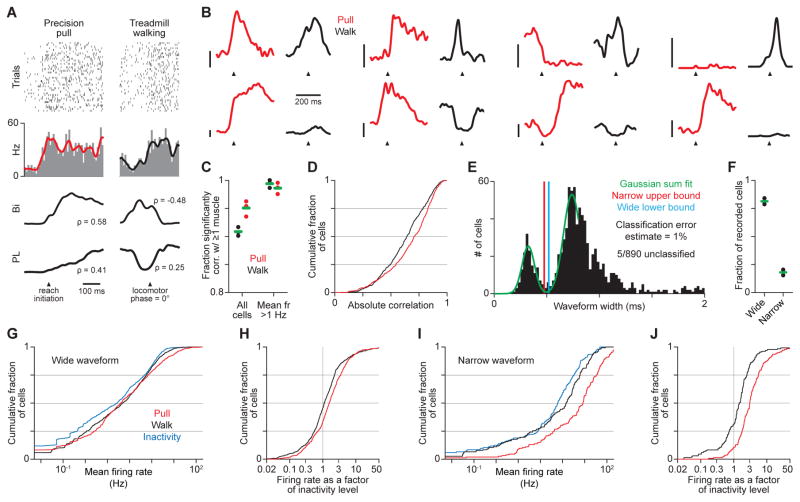
Blocking motor cortical output with lesions or pharmacological inactivation has identified movements that require motor cortex. Yet, when and how motor cortex influences muscle activity during movement execution remains unresolved. We addressed this ambiguity using measurement and perturbation of motor cortical activity together with electromyography in mice during two forelimb movements that differ in their requirement for cortical involvement. Rapid optogenetic silencing and electrical stimulation indicated that short-latency pathways linking motor cortex with spinal motor neurons are selectively activated during one behavior. Analysis of motor cortical activity revealed a dramatic change between behaviors in the coordination of firing patterns across neurons that could account for this differential influence. Thus, our results suggest that changes in motor cortical output patterns enable a behaviorally selective engagement of short-latency effector pathways. The model of motor cortical influence implied by our findings helps reconcile previous observations on the function of motor cortex.

Keywords: channelrhodopsin; motor cortex; mouse; neural dynamics; neural recording.


Figures

Figure 1
Figure 1. The precision pull task
(A) Schematic depicting the precision pull task and its 3 stages. (B) Trial-averaged EMG (black) ± SEM (gray, n = 103) for trapezius (Tra), pectoralis (Pec), biceps (Bi), triceps (Tri), extensor digitorum communis (EDC), and palmaris longus (PL) during precision pull. Scale bar indicates a percentage of maximum in each average; averages normalized by this maximum. (C) Mean ± SEM (n = 6 mice) correlation between trial-averaged EMG from 6 forelimb muscles for individual sessions and their trial averages for the last session plotted (session 14), excluding unrewarded trials. (D) Mean correlation between muscle activation on individual rewarded trials within sessions on the 1st and 14th days of training. Green bars show means (6 mice). (E) Performance in terms of successful (rewarded) pulls over several training sessions for 3 mice. Unilateral injections of muscimol or saline alone into the caudal forelimb region occurred 90 minutes before training. Because sessions vary in length, successes were totaled over the first 30 minutes. (F) Performance before and after unilateral ablation of the caudal forelimb area or sham ablations. Mice were not trained between sessions 1 and 5 days after surgery. See also Figure S1.
Figure 2
Figure 2. Fast timescale motor cortical influence is behavior-specific
(A) Mean ± SEM EMG for trapezius (Tra), pectoralis (Pec), biceps (Bi), triceps (Tri), extensor digitorum communis (EDC), and palmaris longus (PL) during trials with and without 20 Hz blue light stimulation (blue rectangles) starting prior to movement initiation, at reach onset, or at pull onset. Upper left inset shows light stimulus position on the caudal forelimb area (CFA). Vertical blue lines indicate light onset. (B) Same as (A), but for inactivation triggered at a fixed phase of the step cycle during treadmill walking. The biphasic activation of Pec with a larger activation more aligned with that of flexor muscles seen here was present in a minority of mice (2/14). The more common monophasic, extensor-aligned Pec activation pattern during locomotion is seen in Figures S1E–G. (C) Success rate with or without light stimulation prior to movement initiation. (D) Mean ± SEM normalized fractional change in muscle activity between control and inactivation initiated during reaching (n = 4 mice), joystick pulling (n = 4), and treadmill walking (n = 8). (E)–(G) Mean ± SEM normalized fractional change in muscle activity between control and inactivation trials summed over the first 35 ms (E), the next 35 ms (F), or the full duration (G) of light stimulation. See also Figure S2.
Figure 3
Figure 3. Motor cortical stimulation perturbs muscle activity at short latency
(A) EMG from biceps (Bi), triceps (Tri), extensor digitorum communis (EDC), and palmaris longus (PL) in response to electrical stimulation (top) in the caudal forelimb area as a mouse stood still. Vertical magenta lines indicate stimulation onset. (B) Mean ± SEM EMG for muscles in (A) (n = 25 trials). (C) Mean ± SEM absolute change in activity from resting level (n = 25), summed across all four muscles. Current was 90 μA. Dotted line marks the initiation of divergence. (D) Relation between stimulus current and response latency for 1 mouse (circles) fit by an exponential function (red) with a variable asymptote (dotted). Arrow indicates the current level chosen for subsequent stimulation in this mouse. (E) EMG from Bi, Tri, EDC and PL in response to stimulation (top) during walking. (F) Mean ± SEM EMG for muscles in (E) during trials with and without stimulation. Stimulation averages used trials for which stimulation onset fell within a window spanning 1/10th of the step cycle, and the mean stimulation phase for each trial group is given (bottom). (G) Normalized fractional change in EMG during the 50 ms following stimulation onset versus locomotor phase at which stimulation began in 1 mouse. Trials were grouped according to onset phase, and data are plotted along the x axis according to the mean phase for each group. Values are normalized by the maximum absolute change for the given muscle.
Figure 4
Figure 4. Muscle-correlated motor cortical firing during precision pull and treadmill walking
(A) Spike rasters and histograms (top, trial-averaged firing rates overlaid) for 1 neuron and the trial-averaged activation (bottom) of biceps (Bi) and palmaris longus (PL), with correlation scores (ρ) for each EMG trial average with the corresponding neuronal firing rate. (B) Trial-averaged firing rates for 8 neurons during pull and walk. Scale bars are 20 Hz, and their bases indicate 0 Hz along the vertical. Arrowheads indicate muscle activation onset during pull, and a step cycle phase of 0°. (C) Fractions of recorded neurons with firing rates significantly correlated with the activity of at least 1 muscle. Fractions were also computed after ignoring neurons with very low firing rates, which may be poorly estimated. (D) Histograms of the maximum absolute correlation of neuronal firing rates with muscle activity during pull and walk, measured using trial averages. Neurons with mean firing rates < 1 Hz, which may be poorly estimated, were excluded. (E) Waveform widths, with values from 0 to 0.8 ms fit by a sum of two Gaussians, and boundaries for assigning narrow- and wide-spiking subtypes. (F) Fractions of neurons assigned to each subtype. Green bars show means (3 mice). (G)–(J) Histograms of mean firing rates (G),(I) during pull, walk and inactivity, and of firing rates as a factor of their level during inactivity (H),(J) during pull and walk, for wide- (G),(H) and narrow-spiking (I),(J) neurons. Means are measured as the mean of the trial-averaged time series. See also Figures S3, S4.
Figure 5
Figure 5. Scaling between motor cortical firing and muscle activity
(A) Schematics of the scaling between firing rates and muscle activity during pull plotted versus that during walk in hypothetical scenarios. (B),(E),(F) Scaling between firing rates and muscle activity during pull plotted versus that during walk for all cells (B), wide-spiking cells recorded in layer 5b (E), and wide-spiking cells recorded in layer 5b with mean firing rates > 10 Hz during at least 1 behavior (F) for 3 mice. Scaling was only calculated for neurons having mean firing rates > 1 Hz during at least 1 of the 2 behaviors. (C) Histograms of the log of the ratio between pull and walk scaling for all cells, wide-spiking cells recorded in layer 5b, and wide-spiking cells recorded in layer 5b having mean firing rates > 10 Hz during at least 1 behavior. (D) Mean fractions of recorded wide- and narrow-spiking neurons versus tetrode depth (thick lines, 3 mice). Connected black dots are for individual mice.
Figure 6
Figure 6. Changes in firing rate correlations can modulate downstream influence
(A) Schematic depicting how changes in firing rate correlations for two input neurons n1 and n2 can change their modulation of a downstream neuron. Activity depicted in the downstream cell is the sum of input firing rates. (B) Schematic depicting an analogous scenario in which weighted sums of neural activity are modulated differently between behaviors, which could enable behavior-specific effects. (C) Matrices of firing rate correlations in one mouse during precision pull (left) and treadmill walking (right) ordered to cluster neurons with similar correlation patterns during pull (top) and walk (bottom). Each row and the equivalently numbered column correspond to one neuron. Neurons having mean firing rates < 1 Hz during either behavior were excluded. (D) Firing rate correlation for neuron pairs during pull plotted versus their correlation during walk. Every tenth pair plotted from three mice. (E) Histogram of firing rate correlation changes between behaviors, and 105 iterations of the same histogram calculated after data permutation. See also Figure S5.
Figure 7
Figure 7. Behaviorally-selective variation in weighted sums of motor cortical firing patterns
(A) Left: Trial-averaged firing rates for 2 neurons during pull and walk. Scale bars are 20 Hz, and their bases indicate 0 Hz along the vertical. Arrowheads in (A) and (B) indicate muscle activation onset during pull, and a step cycle phase of 0°. Right: Relations between the firing rates over the first 350 ms of the averages for pull and walk, with best-fit lines (solid black). To highlight trends, firing rates for this panel were computed with a 20 ms, rather than a 10 ms, Gaussian. (B) Projection of neuronal population activity from 1 mouse during pull (red) and walk (black) onto the top 4 principal components for the activity during pull (left) and walk (right). (C) Relation between neuronal population activity from 1 mouse during pull and walk projected onto the first principal component for activity during walk and the first principal component for activity during pull minus its projection onto the first axis (Orthogonalized). (D),(E) Mean ± SEM variance captured from pull and walk firing rates by the top principal components for pull and walk, using all neurons (D) or wide-spiking neurons recorded in layer 5b (E). (F) Alignment of firing rates, permuted firing rates, and muscle activity during pull and walk. Green bars show means (3 mice). (G) Relation between the activity of all recorded muscles from 1 mouse during pull and walk projected onto the first principal component for their activity during walk and the first principal component for their activity during pull minus its projection onto the first axis (Orthogonalized). See also Figures S6, S7.

References

    1. Akay T, Acharya HJ, Fouad K, Pearson KG. Behavioral and electromyographic characterization of mice lacking EphA4 receptors. Journal of Neurophysiology. 2006;96:642–651. - PubMed
    1. Alaverdashvili M, Whishaw IQ. Motor cortex stroke impairs individual digit movement in skilled reaching by the rat. Eur J Neurosci. 2008;28:311–322. - PubMed
    1. Armstrong DM, Drew T. Discharges of pyramidal tract and other motor cortical neurones during locomotion in the cat. J Physiol. 1984a;346:471–495. - PMC - PubMed
    1. Armstrong DM, Drew T. Locomotor-related neuronal discharges in cat motor cortex compared with peripheral receptive fields and evoked movements. J Physiol. 1984b;346:497–517. - PMC - PubMed
    1. Armstrong DM, Drew T. Forelimb electromyographic responses to motor cortex stimulation during locomotion in the cat. J Physiol. 1985;367:327–351. - PMC - PubMed