. 2017 Jul 27;170(3):507-521.e18.
doi: 10.1016/j.cell.2017.06.034. Epub 2017 Jul 20.

Genome Organization Drives Chromosome Fragility

Affiliations

Genome Organization Drives Chromosome Fragility

Andres Canela et al. Cell. .

Abstract

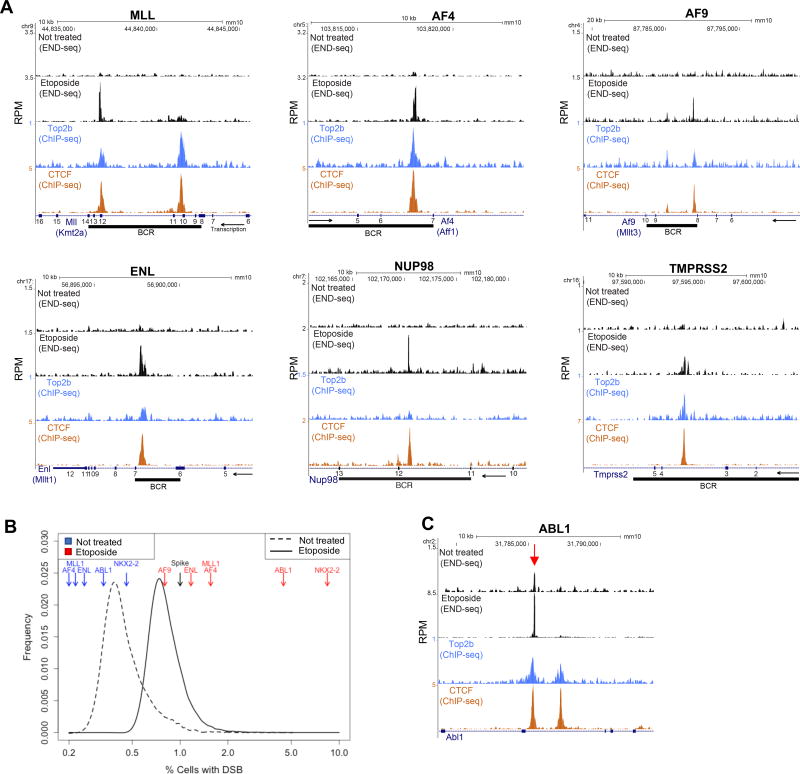
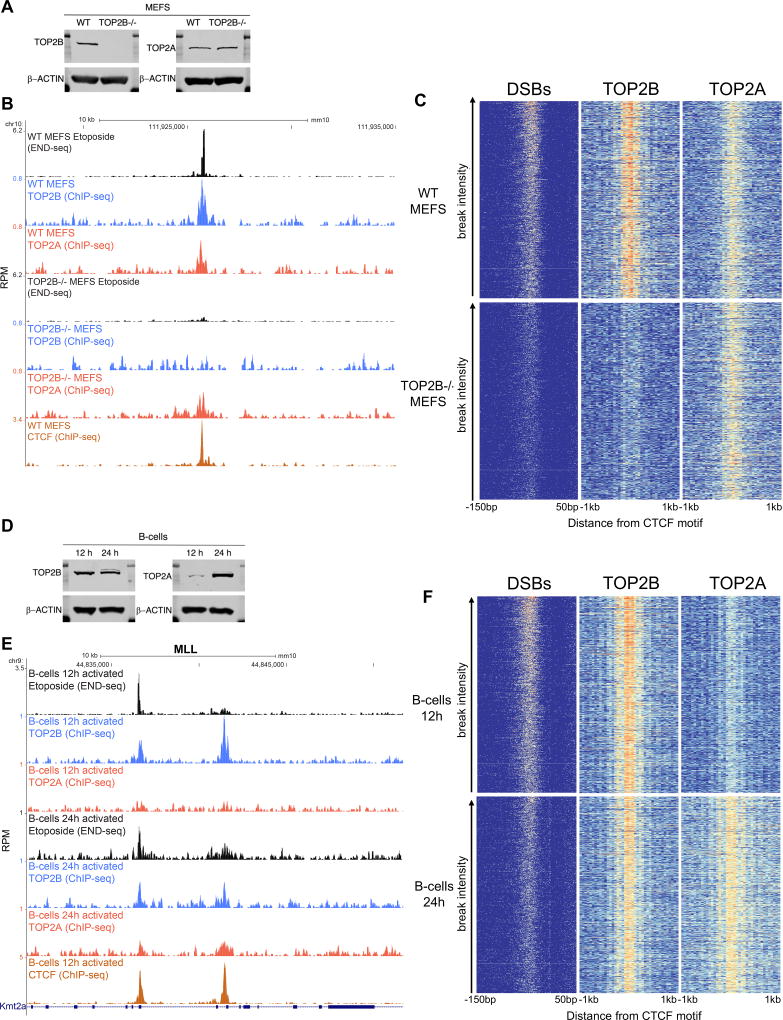
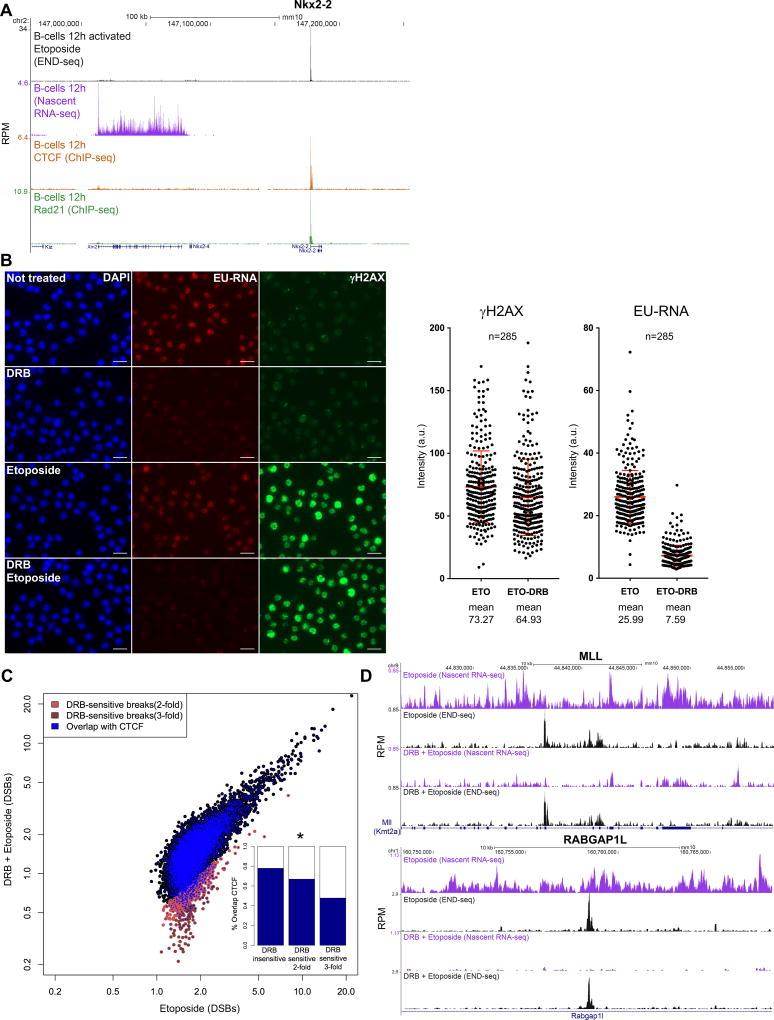
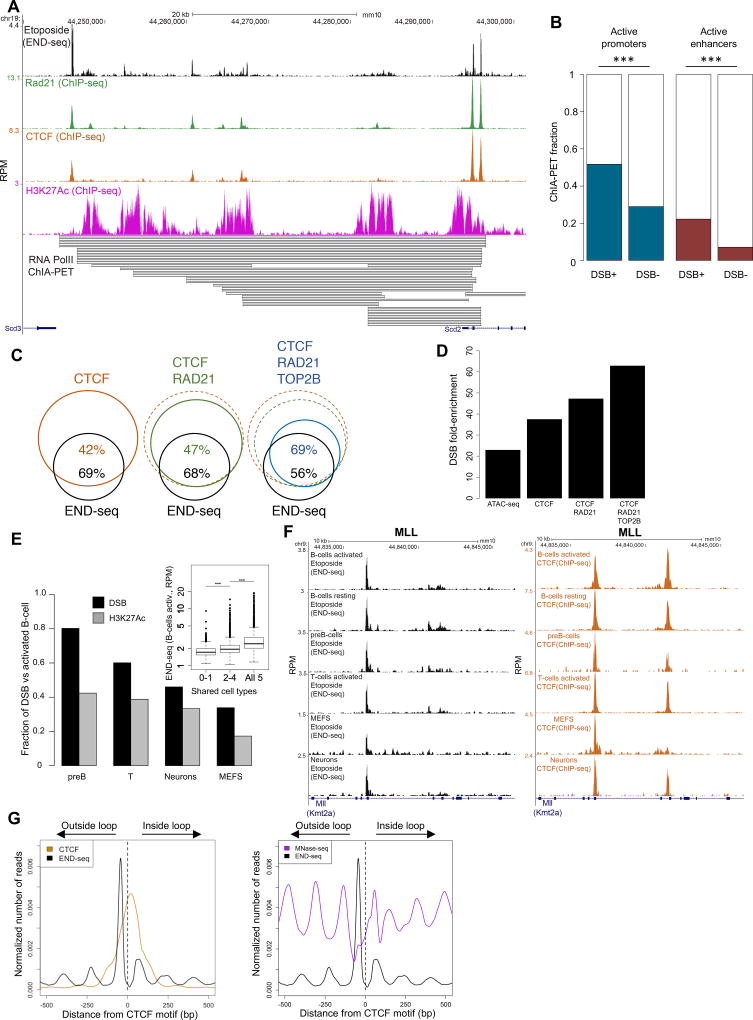
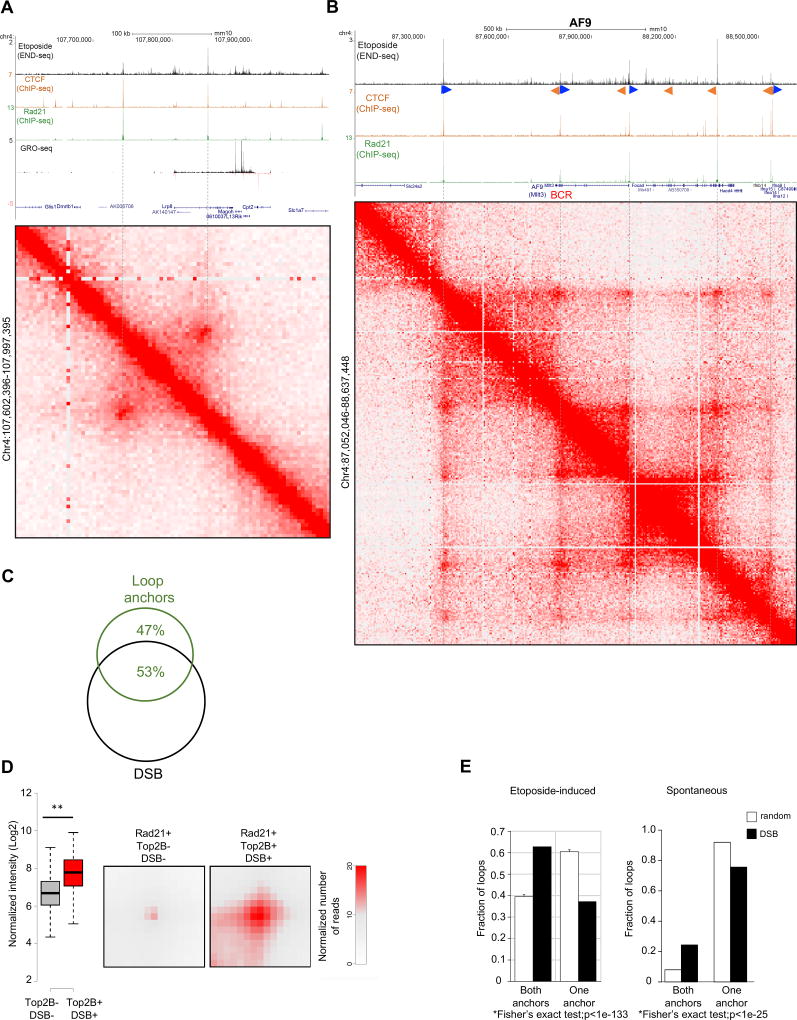
In this study, we show that evolutionarily conserved chromosome loop anchors bound by CCCTC-binding factor (CTCF) and cohesin are vulnerable to DNA double strand breaks (DSBs) mediated by topoisomerase 2B (TOP2B). Polymorphisms in the genome that redistribute CTCF/cohesin occupancy rewire DNA cleavage sites to novel loop anchors. While transcription- and replication-coupled genomic rearrangements have been well documented, we demonstrate that DSBs formed at loop anchors are largely transcription-, replication-, and cell-type-independent. DSBs are continuously formed throughout interphase, are enriched on both sides of strong topological domain borders, and frequently occur at breakpoint clusters commonly translocated in cancer. Thus, loop anchors serve as fragile sites that generate DSBs and chromosomal rearrangements. VIDEO ABSTRACT.

Keywords: DNA breaks; breakpoint cluster regions; cancer; fragile sites; genome instability; topoisomerase; topologically associated domains; translocations.


Figures

Figure 1
Figure 1. Genome-wide mapping of ETO induced DSBs
(A) From top to bottom: END-seq DSBs profiles of normalized read densities without treatment and upon ETO treatment (50µM, 30 minutes) in activated B-cells; TOP2B and CTCF occupancy measured by ChIP-seq in activated B-cells (without ETO treatment). Exons are shown as numbered blue squares, BCR is represented as a black rectangle and was calculated by lift-over of human BCRs. Arrow represents direction of transcription. (B) Estimated frequency of cells carrying a specific DSB, calculated by comparison with the frequency of a zinc finger nuclease break present only in spike-in cells that were mixed with sample cells at 1:100 dilution. Oncogenic BCRs are highlighted in red (ETO treatment) and in blue (without treatment). Continuous and dashed lines represent ETO treatment and no treatment respectively. Quantification was done using END-seq peak coordinates (n=25,512). (C) Spontaneous DSBs at oncogenic driver ABL1 at the same position (arrow) as upon ETO treatment (track below); TOP2B and CTCF occupancy are shown below.
Figure 2
Figure 2. ETO induced DSBs are dependent on TOP2B
(A) Western blot analysis of TOP2B and TOP2A expression in WT and TOP2B−/− MEFs. (B) Example of TOP2B dependency of ETO DSBs in a site located at chr10. From top to bottom, DSBs profile upon ETO treatment, TOP2B and TOP2A occupancy measured by ChIP-seq in WT and TOP2B−/− MEFs, and CTCF occupancy in WT MEFs. (C) Heat-map of DSB coverage, and TOP2B and TOP2A binding (from left to right) in WT and TOP2B−/− MEFs, sorted by cleavage density in WT MEFs (1,000 top most broken sites). Breaks and binding are measured with respect to the center of the CTCF binding motif (−150bp to +50bp for breaks, and −1kb to +1kb for binding, summing up 50bp non-overlapping windows; WT vs TOP2B−/− DSB intensity; paired-T test, p<1×10⁻¹⁵). (D) Western blot analysis of TOP2B and TOP2A expression in 12 hour- (G1 cells) and 24 hour- (dividing cells) stimulated B cells. (E) MLL BCR showing DSBs profile upon ETO treatment (50µM, 30 minutes) and TOP2B and TOP2A occupancy in 12- and 24- hour stimulated B cells. Bottom track shows CTCF occupancy in 12 hour stimulated B cells. ChIP-seq was performed without ETO treatment. (F) Heat-map of DSB coverage, and TOP2B and TOP2A (from left to right) binding in 12- and 24- hour stimulated B cells, sorted by cleavage density in 12 hour stimulated B cells (1,000 top most broken sites). Breaks and binding are measured with respect to the center of the CTCF binding motif (−150bp to +50bp for breaks and −1kb to +1kb for binding).
Figure 3
Figure 3. TOP2B activity is largely transcription independent
(A) Example of a DSB hotspot within exon 1 of Nkx2-2, a gene that is not transcribed in B cells. From top to bottom: DSB profile upon ETO treatment, nascent RNA-seq, and CTCF and RAD21 occupancy. The neighboring gene Xrn2 is actively transcribed but minimally broken. (B) 12 hour activated B cells were assessed for nascent RNA synthesis (red, pulse labeled with EU for 30 minutes) and γ–H2AX induction (green) with or without pre-incubation with the transcriptional inhibitor DRB (150 uM for 90 minutes). Cells were left untreated or treated with ETO (50 uM for 30 minutes) during the EU pulse. Right panel: Quantification of the γ–H2AX and EU-RNA nuclear signal intensity (mean for γ–H2AX: ETO 73.27, DRB+ETO 64.93, p<0.0001 Mann Whitney test; mean for EU-RNA: ETO 25.99, DRB+ETO 7.59, p<0.0001 Mann Whitney test). Number of nuclei (n) indicated on the top. Scale bar in white is 50 µm. (C) ETO-induced DSBs levels quantified by END-seq with (y-axis) or without (x-axis) DRB pre-incubation. DSBs sites are either insensitive to DRB (black), or decrease greater than 2-fold (light red) or 3- fold (dark red) upon DRB pre-incubation. DSB sites (shown in blue) overlap with CTCF binding. The internal graph compares the overlap with CTCF for each DRB sensitive category (Fisher’s exact test, p<5×10⁻⁵). (D) Example of two ETO DSB sites insensitive to transcriptional inhibition, the BCR of MLL (left panel) and intron 1 of Rapgap1l on the right. Top to bottom: Nascent RNA-seq and DSBs profiles upon ETO treatment with or without DRB pre-treatment.
Figure 4
Figure 4. DSBs at loop boundaries
(A) DSBs upon ETO treatment localize to binding sites of CTCF and cohesin at the borders of chromatin loop interactions measured by PolII ChIA-PET. From top to bottom: DSBs profiles upon ETO treatment, RAD21, CTCF and H3K27Ac occupancy by ChIP-seq. PolII ChIA-PET (bottom) reveals multiple RNA polymerase II -mediated loop interactions between the promoter of Scd2 and its upstream enhancers (number of lines proportional to interaction strength). Loop borders show overlap with ETO DSBs, RAD21, CTCF and H3K27Ac. (B) Comparison of the fraction of PolII-mediated loop- borders between promoters or enhancers containing at least one DSB and corresponding sites that are negative for DSBs (Fisher’s exact test, p<1×10−187 for both). (C) Venn diagram shows the overlap between ETO-induced DSBs and CTCF binding in 12 hour activated B cells (Left); the overlap between ETO-induced DSBs with the co-binding of CTCF and RAD21 (green, middle), and the overlap between ETO induced DSBs with CTCF, RAD21 and TOP2B (blue, right). (D) Comparison of the enrichment for DSBs with incremental co-binding (CTCF, CTCF/RAD21 and CTCF/RAD21/TOP2B relative to randomly located regions with identical size. Enrichment of DSBs for ATAC-seq positive sites is shown for comparison. (E) Conservation of DSBs (black) co-bound by CTCF, RAD21 and TOP2B in activated B-cells among different cell types (pre-B cell line, T cells, neurons and MEFs) as measured by END-seq. Conservation in H3K27Ac between activated B-cells and each cell type is shown (gray) as a comparison. H3K27Ac peak subsets were picked to have the same number of peaks and size distribution as their corresponding DSBs peak sets. Inset compares DSB levels in activated B cells that are shared to different degrees among unstimulated B cells, pre-B cells, T cells, neurons and MEFs (Two-sided t-test, p<1×10−130). (F) MLL BCR showing ETO-induced DSBs (left) and CTCF binding (right) conservation between different cell types. (G) Left panel: aggregate plot of ETO-induced DSBs (solid black) and CTCF binding (orange) +/− 500 bp from the CTCF motif (dashed line). Right panel: MNase-seq signal (purple) superimposed on the DSB profile.
Figure 5
Figure 5. Loop anchor location and strength are associated with DSBs
(A) Top to bottom: DSBs profiles upon ETO treatment, CTCF and RAD21 occupancy measured by ChIP-seq; RNA synthesis by GRO-seq; and Hi-C contact matrices (position chr4:107,602,396–107,997,395, mm10) showing a loop near the Lrp8 gene. DSBs colocalize to loop anchor positions (dashed lines). (B) Oncogenic breakpoint cluster region (BCR) within the MLL translocation partner AF9 overlaps with loop anchor position, CTCF/cohesin binding and DSBs (See also Figure S4). From top to bottom: DSBs profiles upon ETO treatment, CTCF and Rad21 occupancy measured by ChIP-seq; and Hi-C contact matrices for chr4 (positions 87,052,046 to 88,637,448, mm10), which reveals multiple chromatin loop interactions (resolution 5kb). G-rich and C-rich orientation of the CTCF motifs, are shown as blue, respectively. BCR position is indicated in red. (C) Overlap between loop anchors and DSBs. Loop anchors were defined as regions within 5kb from the Hi-C loop boundary (see Methods) with CTCF and RAD21 co-binding. Loop anchor regions, identified by Hi-C, were considered overlapping with DSBs if intersecting with at least one END-seq peak. The level of overlap between loop anchors and DSBs was greater than the overlap between loop anchors and randomly generated CTCF/RAD21 double peaks (Hypergeometric test, p<1×10⁻¹⁵). (D) Aggregate peak analysis (APA) plots display the average Hi-C signal at anchor loop positions (RAD21+) that are either associated or not with DSBs. Left panel, whisker plot representation of the normalized signal between anchor loops associated or not with DSBs (two-sided t-test, p<1×10⁻²⁵); right panel, aggregate signal at loop anchor positions. Aggregate peak signal shown in red indicates that DSB-associated anchors have stronger loop interactions. (E) Percentage of loop borders positive for DSBs that either have DSBs on both sides (see for example Figure 5A) or only on one side (observed), compared to randomly paired anchors (expected) (Fisher’s exact test, p<1×10−133). Left and right panels quantify ETO-induced and spontaneous breaks respectively.
Figure 6
Figure 6. Polymorphisms in CTCF/Cohesin alter DSB position and frequency
(A) Left panel, Venn diagram of CTCF+RAD21+ sites of Mus spretus (Spretus) and Mus musculus (C57BL/6) in activated B-cells. Right panel, comparison of the fraction of sites that break between shared, C57BL/6 and Spretus CTCF+RAD21+ sites (Chi-square test for independence, p<1×10⁻²⁰). (B–D) Examples of DSB sites that are shared or exclusive between Spretus and C57BL/6. DSB profiles upon ETO treatment and CTCF/RAD21 occupancy measured by ChIP-seq for each species is shown. (E) Ratio of DSB levels and RAD21 occupancy between C57BL/6 and Spretus at shared CTCF+RAD21+ binding sites are compared (Spearman correlation, ρ=0.56; p<1e-15). (F) Comparison between integrated NIPBL binding within the loops (defined by Hi-C) and DSBs located at corresponding loop anchors (Spearman correlation, ρ=0.54; p<1×10⁻¹⁵), as illustrated below. (G) Extruding cohesin rings (green) load (black arrow) and travel through the chromatin fiber until they are trapped by a pair of adjacent CTCF proteins positioned in a convergent orientation (blue and red triangles). As the extrusion complex advances, entanglements or knots build up ahead of the motor. TOP2B (purple) maybe necessary to relieve accumulated topological stress to promote loop formation. DSBs also have the potential to drive mutation and chromosomal rearrangements that promote cancer.

Comment in

  • Anchoring Chromatin Loops to Cancer.
    Fowler F, Tyler JK. Fowler F, et al. Dev Cell. 2017 Aug 7;42(3):209-211. doi: 10.1016/j.devcel.2017.07.013. Dev Cell. 2017. PMID: 28787588 Free PMC article.

References

    1. Alipour E, Marko JF. Self-organization of domain structures by DNA-loop-extruding enzymes. Nucleic acids research. 2012;40:11202–11212. - PMC - PubMed
    1. Aplan PD. Chromosomal translocations involving the MLL gene: molecular mechanisms. DNA repair. 2006;5:1265–1272. - PMC - PubMed
    1. Baranello L, Kouzine F, Wojtowicz D, Cui K, Przytycka TM, Zhao K, Levens D. DNA break mapping reveals topoisomerase II activity genome-wide. Int J Mol Sci. 2014;15:13111–13122. - PMC - PubMed
    1. Baranello L, Wojtowicz D, Cui K, Devaiah BN, Chung HJ, Chan-Salis KY, Guha R, Wilson K, Zhang X, Zhang H, et al. RNA Polymerase II Regulates Topoisomerase 1 Activity to Favor Efficient Transcription. Cell. 2016;165:357–371. - PMC - PubMed
    1. Barlow JH, Faryabi RB, Callen E, Wong N, Malhowski A, Chen HT, Gutierrez-Cruz G, Sun HW, McKinnon P, Wright G, et al. Identification of early replicating fragile sites that contribute to genome instability. Cell. 2013;152:620–632. - PMC - PubMed