. 2017 Aug 7;27(15):2296-2306.e3.
doi: 10.1016/j.cub.2017.06.044. Epub 2017 Jul 20.

Protein Interaction Analysis Provides a Map of the Spatial and Temporal Organization of the Ciliary Gating Zone

Affiliations

Protein Interaction Analysis Provides a Map of the Spatial and Temporal Organization of the Ciliary Gating Zone

Daisuke Takao et al. Curr Biol. .

Abstract

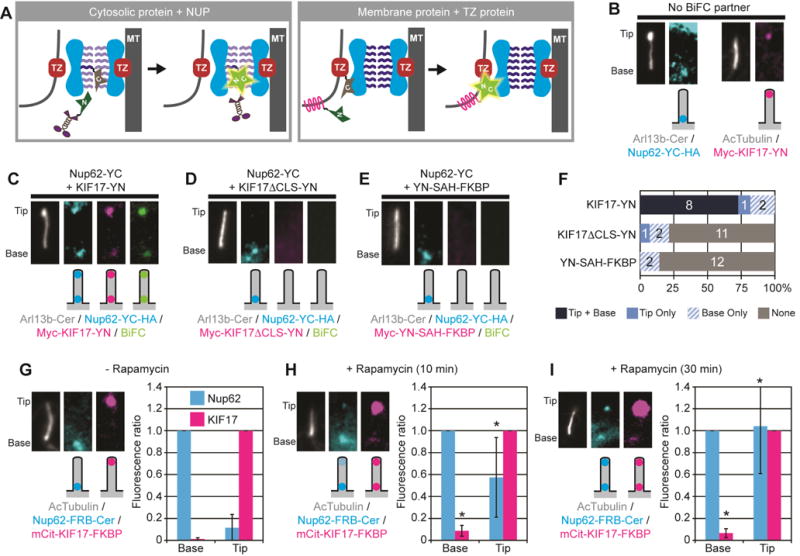
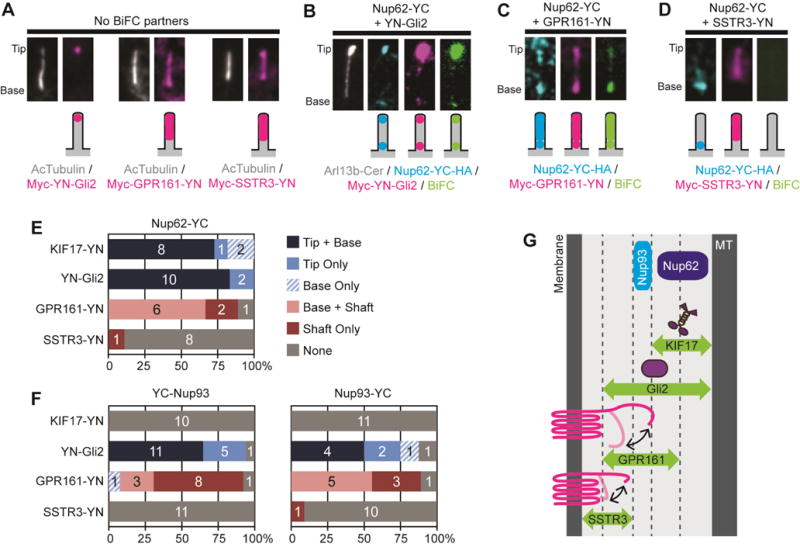
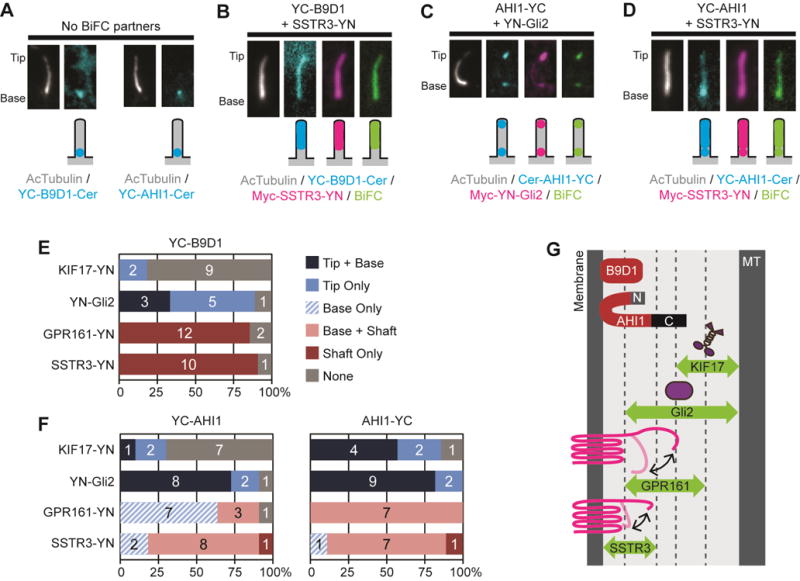
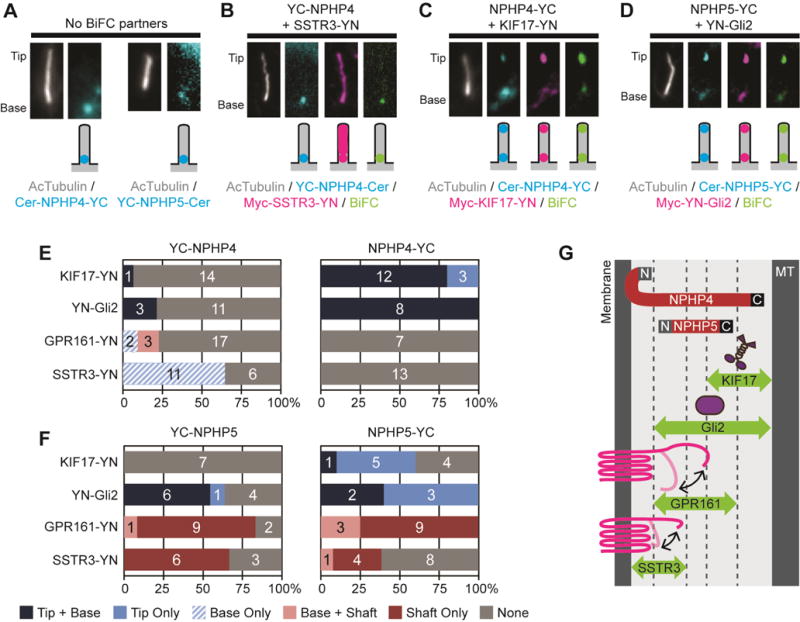
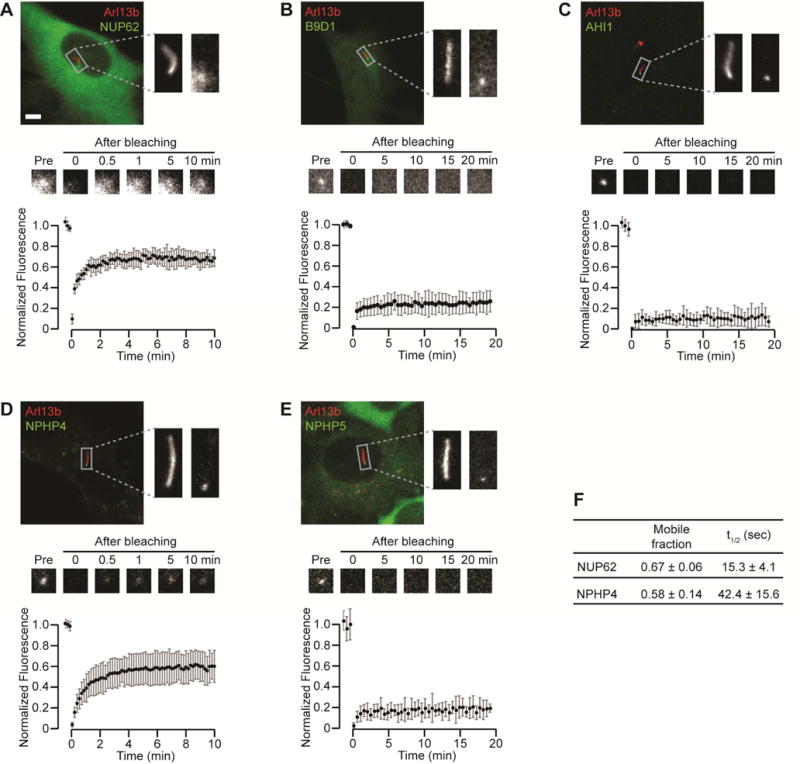
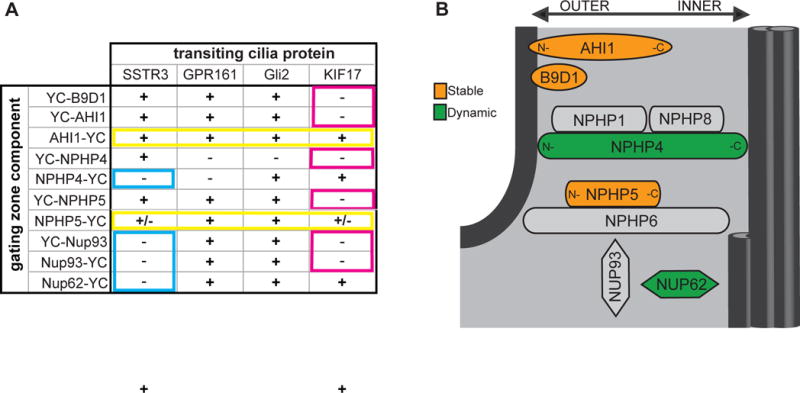
The motility and signaling functions of the primary cilium require a unique protein and lipid composition that is determined by gating mechanisms localized at the base of the cilium. Several protein complexes localize to the gating zone and may regulate ciliary protein composition; however, the mechanisms of ciliary gating and the dynamics of the gating components are largely unknown. Here, we used the BiFC (bimolecular fluorescence complementation) assay and report for the first time on the protein-protein interactions that occur between ciliary gating components and transiting cargoes during ciliary entry. We find that the nucleoporin Nup62 and the C termini of the nephronophthisis (NPHP) proteins NPHP4 and NPHP5 interact with the axoneme-associated kinesin-2 motor KIF17 and thus spatially map to the inner region of the ciliary gating zone. Nup62 and NPHP4 exhibit rapid turnover at the transition zone and thus define dynamic components of the gate. We find that B9D1, AHI1, and the N termini of NPHP4 and NPHP5 interact with the transmembrane protein SSTR3 and thus spatially map to the outer region of the ciliary gating zone. B9D1, AHI1, and NPHP5 exhibit little to no turnover at the transition zone and thus define components of a stable gating structure. These data provide the first comprehensive map of the molecular orientations of gating zone components along the inner-to-outer axis of the ciliary gating zone. These results advance our understanding of the functional roles of gating zone components in regulating ciliary protein composition.

Keywords: axoneme; cilia; flagella; gating; import; intraflagellar transport; kinesin; nephronophthisis; nucleoporin; transition zone.


Figures

Figure 1
Figure 1. The BiFC assay maps protein interactions at the ciliary gating zone
(A) Schematic of BiFC assay. The N- and C-terminal halves of a YFP (half-stars labeled N or C), when fused to proteins of interest, can reconstitute a fluorescent protein only when brought in close proximity via the interactions of their fusion partners. TZ, transition zone proteins. MT, axonemal microtubules. (B) Localization of Nup62-YC (left) and KIF17-YN (right) expressed in the absence of a BiFC partner. Arl13b-Cer or acetylated α-tubulin (AcTubulin) was used as a cilium marker. Images are of cropped regions containing the cilium, contrast-enhanced for viewing, with a schematic of the observed fluorescence localization shown below each fluorescence image. (C–E) Representative images and schematic depictions show the locations of BiFC interactions detected for Nup62-YC with (C) kinesin-2 motor KIF17-YN, (D) KIF17 with mutated CLS (KIF17ΔCLS-YN), or (E) non-ciliary protein (YN-SAH-FKBP). Nup62-YC was detected with an antibody to the HA tag (Nup62-YC-HA) whereas the KIF17 and SAH constructs were detected with an antibody to the Myc tag. See Table S1 for full description of constructs. See Figure S1 for uncropped images. (F) Quantification of the locations of BiFC interactions. The number of cells observed for each BiFC location category is indicated on the bar graph. (G–I) Time course of interaction between Nup62 and KIF17. Nup62-FRB-Cer and mCit-KIF17-FKBP were co-expressed and the cells were fixed after treatment with (G) ethanol (- Rapamycin control), (H) 10 min Rapamycin, or (I) 30 min Rapamycin. Graphs show the mean fluorescence of Nup62-FRB-Cer at the base or tip of the cilium (normalized to the fluorescence at the base) or the mean fluorescence of mCit-KIF17-FKBP at the base or tip of the cilium (normalized to the fluorescence at the tip). *p<0.01 compared to control (-rapamycin) by Student’s t-test. Error bars, S.D. n = 10–14 cells each.
Figure 2
Figure 2. Interactions between NUP components and transiting cilia proteins
(A) Representative images showing the ciliary localizations of YN-Gli2, GPR161-YN, and SSTR3-YN expressed in the absence of a BiFC partner. (B–D) Representative images and schematic depictions show the locations of BiFC interactions detected for Nup62-YC with (B) YN-Gli2, (C) GPR161-YN, or (D) SSTR3-YN. Proteins were detected with antibodies to the epitope tags. See Table S1 for full description of constructs. See Figure S2 for uncropped images. (E,F) Quantification of the locations of BiFC interactions for (E) Nup62 or (F) Nup93 constructs. The number of cells observed for each BiFC location category is indicated on the bar graph. See Figure S3 for representative images of YC-Nup93 and Nup93-YC BiFC interactions. (G) The BiFC interactions define the locations of Nup62 and Nup93 in the inner region of the ciliary gating zone. MT, axonemal microtubules.
Figure 3
Figure 3. Interactions between MKS components and transiting cilia proteins
(A) Representative images showing the ciliary localizations of the MKS components YC-B9D1 and YC-AHI1 expressed in the absence of a BiFC partner. (B–D) Representative images and schematic depictions of locations of BiFC interactions for select B9D1 and AHI1 combinations. Proteins were detected using fluorescent tags or antibodies to the epitope tags. See Table S1 for full description of constructs. See Figure S4 for images of YC-B9D1 and YC-AHI1 BiFC interactions. (E,F) Quantification of the locations of the BiFC interactions for (E) B9D1 or (F) AHI1 constructs. The number of cells observed for each BiFC location category is indicated on the bar graph. (G) The BiFC assay defines the positions and orientations of B9D1 and AHI1 at the outer region of the ciliary gating zone.
Figure 4
Figure 4. Interactions between NPHP components and transiting cilia proteins
(A) Representative images showing the ciliary localizations of NPHP4-YC and YC-NPHP5 expressed without a BiFC partner. (B–D) Representative images and schematic depictions of BiFC interactions for select NPHP4 and NPHP5 combinations. Proteins were detected with fluorescent tags or with antibodies to the epitope tags. See Table S1 for full description of the constructs. See Figure S6 for representative images. (E,F) Quantification of the locations of the BiFC interactions for (E) NPHP4 or (F) NPHP5 constructs. The number of cells observed for each BiFC location category is indicated on the bar graph. (G) The BiFC assay defines the positions and orientations of NPHP4 and NPHP5 within the ciliary gating zone.
Figure 5
Figure 5. Dynamics of ciliary gating zone proteins
(A–E) FRAP analysis of the gating components (A) Nup62-mCit, (B) B9D1-NeonGreen, (C) EGFP-AHI1, (D) mCherry-NPHP4 (pseudocolored green), and (E) EGFP-NPHP5. Arl13b-mCherry or Arl13b-mCit was used as a cilium marker (red in all images). The top panels show representative fluorescence images with magnified images of the boxed region containing the primary cilium. The middle panels show representative time-lapse images of fluorescence recovery at the cilium base. The bottom panels show fluorescence recovery curves. n = 7–14 cells each. Graphs show the mean +/− S.D. fluorescence intensity (A.U.=Arbitrary Units) over time. Scale bar, 5 μm. (F) The mobile fraction and half recovery time (t1/2) were calculated for the dynamic components Nup62 and NPHP4 by fitting an exponential curve to the fluorescence recovery data.
Figure 6
Figure 6. Dynamics of the MKS component B9D1 at the base of the cilium
(A) Representative images and schematic depictions of locations of FRB-B9D1 and SSTR3-FKBP. Cells were treated with ethanol (- Rapamycin control) or rapamycin for the indicated times. (B) Quantification of the locations of the FRB-B9D1-Cer and Myc-SSTR3-FKBP interactions in cilia. The number of cells observed for each location category is indicated on the bar graphs.
Figure 7
Figure 7. Model of the spatial organization and dynamics of ciliary gating components
(A) Summary of BiFC interactions. (+) = BiFC signal detected in cilium, (−) = little to no BIFC signal detected. Blue boxes: Nup62, Nup93 and the C-terminus of NPHP4 are unable to interact with the short cytoplasmic tail of transmembrane protein SSTR3 and thus localize to the inner region of the ciliary gating zone. Pink boxes: B9D1, Nup93, and the N-termini of AHI1, NPHP4, and NPHP5 are unable to interact with the KIF17 motor protein and are thus oriented to the outer region of the gating zone. Yellow boxes: the C-termini of AHI1 and NPHP5 interact with all transiting proteins and are thus widely accessible throughout the ciliary gating zone. (b) Schematic of the localizations and dynamics of ciliary gating components. The relative positioning of ciliary gating zone components along the inner-to-outer axis is shown. The relative dynamics of the components is indicated by the color shading where orange = stable components, green = dynamic components, gray = unknown.

References

    1. Fry AM, Leaper MJ, Bayliss R. The primary cilium: guardian of organ development and homeostasis. Organogenesis. 2014;10:62–68. - PMC - PubMed
    1. Madhivanan K, Aguilar RC. Ciliopathies: the trafficking connection. Traffic. 2014;15:1031–1056. - PMC - PubMed
    1. Takao D, Verhey KJ. Gated entry into the ciliary compartment. Cell Mol Life Sci. 2016;73:119–127. - PMC - PubMed
    1. Verhey KJ, Yang W. Permeability barriers for generating a unique ciliary protein and lipid composition. Curr Opin Cell Biol. 2016;41:109–116. - PMC - PubMed
    1. Davis EE, Katsanis N. The ciliopathies: a transitional model into systems biology of human genetic disease. Curr Opin Genet Dev. 2012;22:290–303. - PMC - PubMed

LinkOut - more resources