. 2017;112(517):64-76.
doi: 10.1080/01621459.2016.1192039. Epub 2017 May 3.

The Generalized Higher Criticism for Testing SNP-Set Effects in Genetic Association Studies

Affiliations

The Generalized Higher Criticism for Testing SNP-Set Effects in Genetic Association Studies

Ian Barnett et al. J Am Stat Assoc. 2017.

Abstract

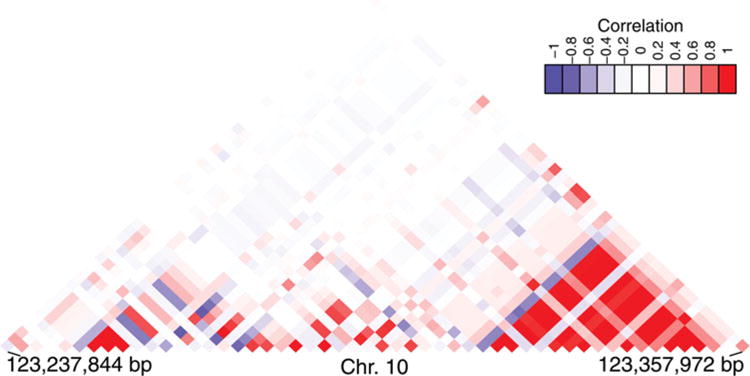
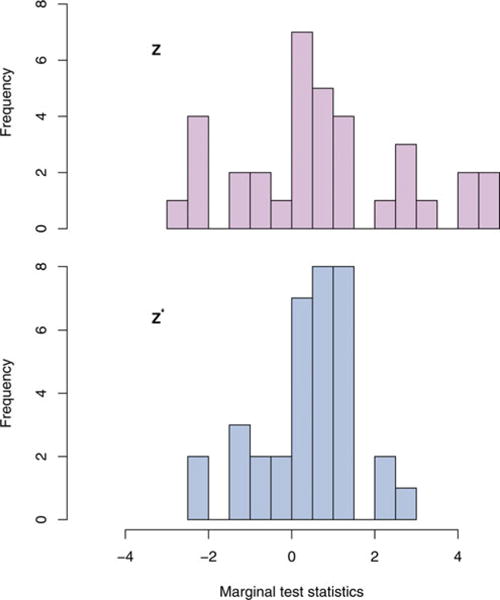
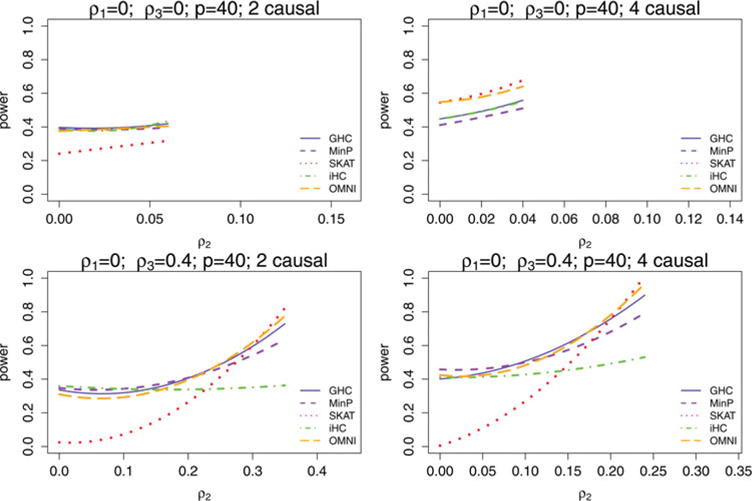
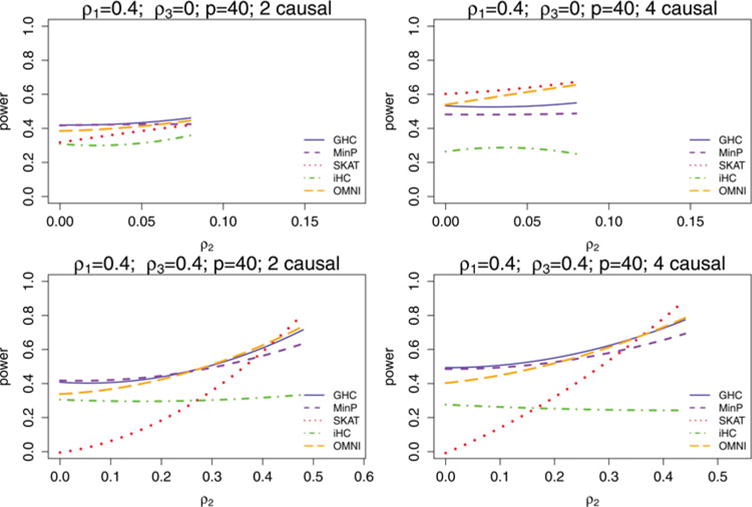
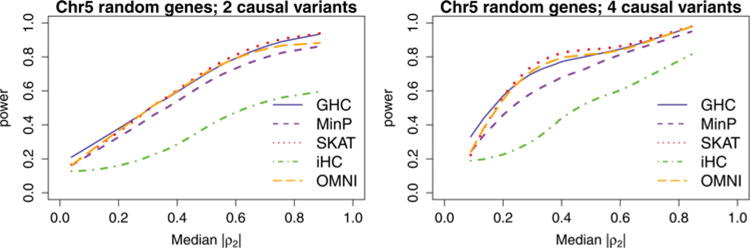
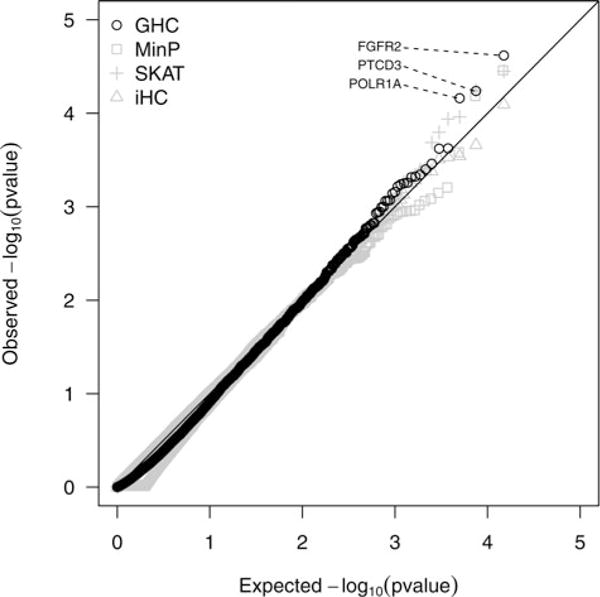
It is of substantial interest to study the effects of genes, genetic pathways, and networks on the risk of complex diseases. These genetic constructs each contain multiple SNPs, which are often correlated and function jointly, and might be large in number. However, only a sparse subset of SNPs in a genetic construct is generally associated with the disease of interest. In this article, we propose the generalized higher criticism (GHC) to test for the association between an SNP set and a disease outcome. The higher criticism is a test traditionally used in high-dimensional signal detection settings when marginal test statistics are independent and the number of parameters is very large. However, these assumptions do not always hold in genetic association studies, due to linkage disequilibrium among SNPs and the finite number of SNPs in an SNP set in each genetic construct. The proposed GHC overcomes the limitations of the higher criticism by allowing for arbitrary correlation structures among the SNPs in an SNP-set, while performing accurate analytic p-value calculations for any finite number of SNPs in the SNP-set. We obtain the detection boundary of the GHC test. We compared empirically using simulations the power of the GHC method with existing SNP-set tests over a range of genetic regions with varied correlation structures and signal sparsity. We apply the proposed methods to analyze the CGEM breast cancer genome-wide association study. Supplementary materials for this article are available online.

Keywords: Correlated test statistics; Detection boundary; Genetic association testing; Higher criticism; Multiple hypothesis testing; Signal detection.


Figures

Figure 1
Figure 1
The LD plot of the FGFR2 gene based on the CGEM genetic association study of breast cancer data. Pearson correlations are displayed, with negative correlations in blue and positive correlations in red.
Figure 2
Figure 2
The marginal test statistics for 35 SNPs from the FGFR2 gene, each with MAF > 0.05, from the CGEM genetic association study of breast cancer are plotted. The original test statistics Z are in the top histogram, while the transformed test statistics Z = U−1Z are in the bottom histogram.
Figure 3
Figure 3
Power comparison of GHC, iHC, SKAT, MinP, and OMNI in hypothetical gene situations where there is no correlation within the causal variants (ρ1 0), for different correlations among the noncausal variants ρ3, as a function of the correlation between the causal and noncausal variants ρ2. Two sparsity levels were considered. Starting with ρ2 = 0, power is estimated from 500 simulations for each possible ρ2 > 0 that is a multiple of 0.01. There is a limit on how large ρ2 can be relative to ρ1 and ρ3 so that the correlation matrix remains positive definite, and for this reason the range of ρ2 values that power is estimated for varies with ρ1 and ρ3.
Figure 4
Figure 4
Power comparison of GHC, iHC, SKAT, MinP, and OMNI in hypothetical gene situations where the correlation within the causal variants is ρ1 = 0.4 for different correlations among the noncausal variants ρ3, as a function of the correlation between the causal and noncausal variants ρ2. Two sparsity levels were considered. Starting with ρ2 = 0, power is estimated from 500 simulations for each possible ρ2 > 0 that is a multiple of 0.01. There is a limit on how large ρ2 can be relative to ρ1 and ρ3 so that the correlation matrix remains positive definite, and for this reason the range of ρ2 values that power is estimated for varies with ρ1 and ρ3.
Figure 5
Figure 5
Power comparison of GHC, iHC, SKAT, and MinP for all the genes in Chromosome 5. For each of the 839 genes in chromosome 5, causal SNPs are selected at random and power is estimated at the α = 0.05 level based on 100 simulations. Additionally, the median correlation between causal SNPs and noncausal SNPs (ρ2) is recorded. The smoothed curves to each of these power estimates is displayed.
Figure 6
Figure 6
Q–Q plot of p-values for the SNP-set tests on the CGEM breast cancer GWAS data. SNP-sets were constructed at the gene-level, also including SNPs within 20 kb from the border of each gene. SNP-sets with 4 or fewer SNPs were not included in the analysis leading to total of 14,991 SNP-sets evaluated.

References

    1. Andrews DW, Pollard D. An Introduction to Functional Central Limit Theorems for Dependent Stochastic Processes. International Statistical Review/Revue Internationale de Statistique. 1994;62:119–132.
    1. Arias-Castro E, Candès E, Plan Y. Global Testing Under Sparse Alternatives: Anova, Multiple Comparisons and the Higher Criticism. The Annals of Statistics. 2011;39:2533–2556.
    1. Barnett IJ, Lin X. Analytical p-Value Calculation for the Higher Criticism Test in Finite-d Problems. Biometrika. 2014;101:964–970. - PMC - PubMed
    1. Boehm JS, Zhao JJ, Yao J, Kim SY, Firestein R, Dunn IF, Sjostrom SK, Garraway LA, Weremowicz S, Richardson AL, et al. Integrative Genomic Approaches Identify IKBKE as a Breast Cancer Oncogene. Cell. 2007;129:1065–1079. - PubMed
    1. Chen H, Meigs JB, Dupuis J. Sequence Kernel Association Test for Quantitative Traits in Family Samples. Genetic Epidemiology. 2013;37:196–204. - PMC - PubMed

Publication types