

Impact of automated ICA-based denoising of fMRI data in acute stroke patients
- PMID: 28736698
- PMCID: PMC5508492
- DOI: 10.1016/j.nicl.2017.06.033
Impact of automated ICA-based denoising of fMRI data in acute stroke patients
Abstract
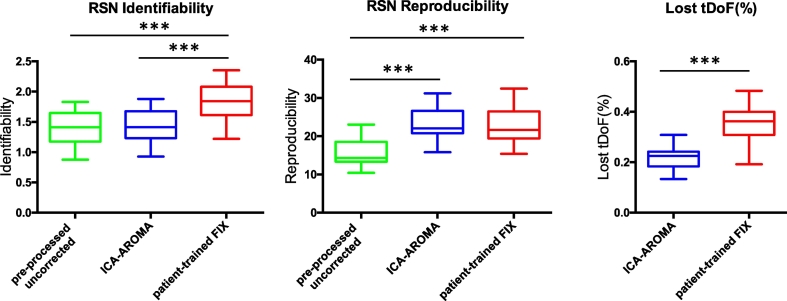
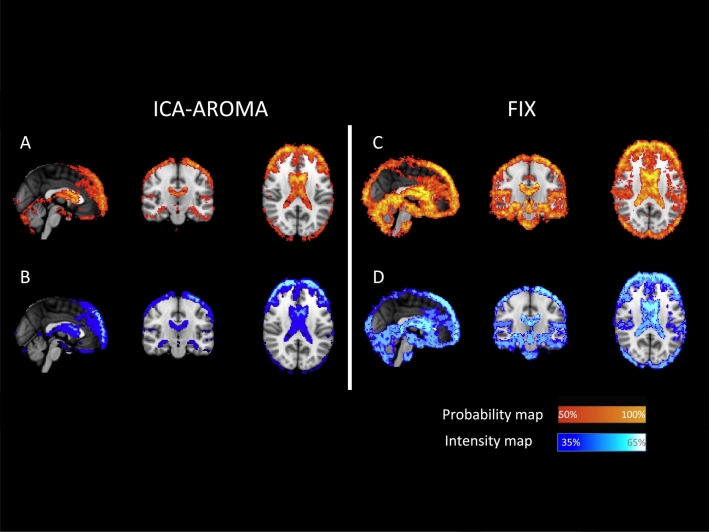
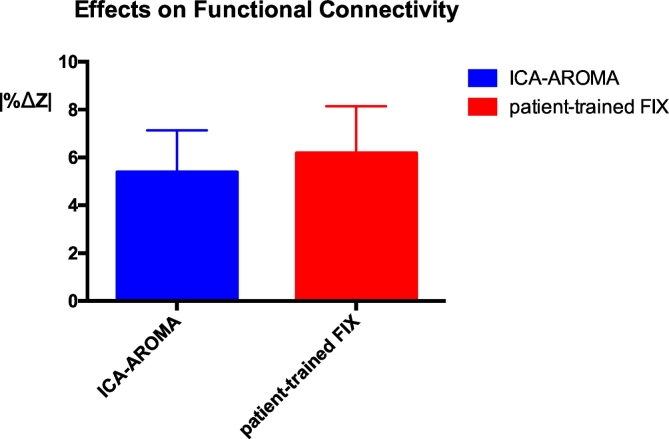
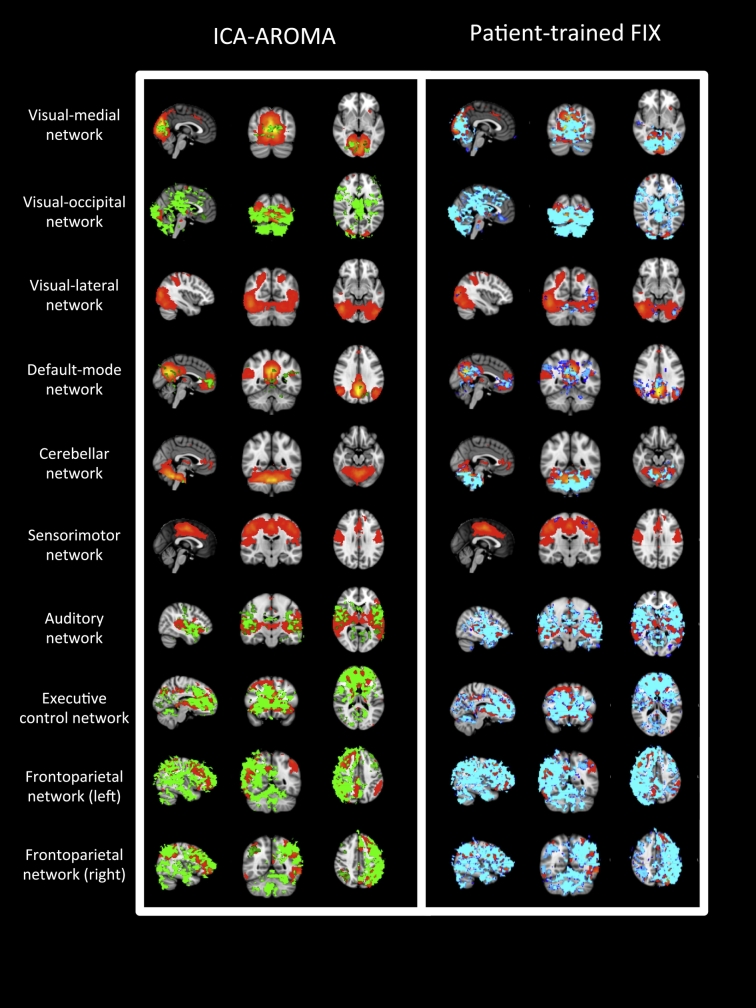
Different strategies have been developed using Independent Component Analysis (ICA) to automatically de-noise fMRI data, either focusing on removing only certain components (e.g. motion-ICA-AROMA, Pruim et al., 2015a) or using more complex classifiers to remove multiple types of noise components (e.g. FIX, Salimi-Khorshidi et al., 2014 Griffanti et al., 2014). However, denoising data obtained in an acute setting might prove challenging: the presence of multiple noise sources may not allow focused strategies to clean the data enough and the heterogeneity in the data may be so great to critically undermine complex approaches. The purpose of this study was to explore what automated ICA based approach would better cope with these limitations when cleaning fMRI data obtained from acute stroke patients. The performance of a focused classifier (ICA-AROMA) and a complex classifier (FIX) approaches were compared using data obtained from twenty consecutive acute lacunar stroke patients using metrics determining RSN identification, RSN reproducibility, changes in the BOLD variance, differences in the estimation of functional connectivity and loss of temporal degrees of freedom. The use of generic-trained FIX resulted in misclassification of components and significant loss of signal (< 80%), and was not explored further. Both ICA-AROMA and patient-trained FIX based denoising approaches resulted in significantly improved RSN reproducibility (p < 0.001), localized reduction in BOLD variance consistent with noise removal, and significant changes in functional connectivity (p < 0.001). Patient-trained FIX resulted in higher RSN identifiability (p < 0.001) and wider changes both in the BOLD variance and in functional connectivity compared to ICA-AROMA. The success of ICA-AROMA suggests that by focusing on selected components the full automation can deliver meaningful data for analysis even in population with multiple sources of noise. However, the time invested to train FIX with appropriate patient data proved valuable, particularly in improving the signal-to-noise ratio.
Keywords: Acute stroke; BOLD; Denoising; Independent component analysis; Resting state; fMRI.
Figures
Similar articles
-
Evaluation of ICA-AROMA and alternative strategies for motion artifact removal in resting state fMRI.Neuroimage. 2015 May 15;112:278-287. doi: 10.1016/j.neuroimage.2015.02.063. Epub 2015 Mar 11. Neuroimage. 2015. PMID: 25770990
-
ICA-AROMA: A robust ICA-based strategy for removing motion artifacts from fMRI data.Neuroimage. 2015 May 15;112:267-277. doi: 10.1016/j.neuroimage.2015.02.064. Epub 2015 Mar 11. Neuroimage. 2015. PMID: 25770991
-
Automatic denoising of functional MRI data: combining independent component analysis and hierarchical fusion of classifiers.Neuroimage. 2014 Apr 15;90:449-68. doi: 10.1016/j.neuroimage.2013.11.046. Epub 2014 Jan 2. Neuroimage. 2014. PMID: 24389422 Free PMC article.
-
Methods for cleaning the BOLD fMRI signal.Neuroimage. 2017 Jul 1;154:128-149. doi: 10.1016/j.neuroimage.2016.12.018. Epub 2016 Dec 9. Neuroimage. 2017. PMID: 27956209 Free PMC article. Review.
-
Multi-echo fMRI: A review of applications in fMRI denoising and analysis of BOLD signals.Neuroimage. 2017 Jul 1;154:59-80. doi: 10.1016/j.neuroimage.2017.03.033. Epub 2017 Mar 29. Neuroimage. 2017. PMID: 28363836 Review.
Cited by
-
Neurochemistry and functional connectivity in the brain of people with Charles Bonnet syndrome.Ther Adv Ophthalmol. 2024 Oct 15;16:25158414241280201. doi: 10.1177/25158414241280201. eCollection 2024 Jan-Dec. Ther Adv Ophthalmol. 2024. PMID: 39416975 Free PMC article.
-
Associations between thalamocortical functional connectivity and sensory over-responsivity in infants at high likelihood for ASD.Cereb Cortex. 2023 Jun 8;33(12):8075-8086. doi: 10.1093/cercor/bhad100. Cereb Cortex. 2023. PMID: 37005061 Free PMC article.
-
Performance of Temporal and Spatial Independent Component Analysis in Identifying and Removing Low-Frequency Physiological and Motion Effects in Resting-State fMRI.Front Neurosci. 2022 Jun 10;16:867243. doi: 10.3389/fnins.2022.867243. eCollection 2022. Front Neurosci. 2022. PMID: 35757543 Free PMC article.
-
Mitigating head motion artifact in functional connectivity MRI.Nat Protoc. 2018 Dec;13(12):2801-2826. doi: 10.1038/s41596-018-0065-y. Nat Protoc. 2018. PMID: 30446748 Free PMC article.
-
Changes in Resting-State Neural Activity and Nerve Fibres in Ischaemic Stroke Patients with Hemiplegia.Brain Topogr. 2023 Mar;36(2):255-268. doi: 10.1007/s10548-022-00937-6. Epub 2023 Jan 5. Brain Topogr. 2023. PMID: 36604349
References
-
- Andrews R.J. Transhemispheric diaschisis. A review and comment. Stroke. 1991;22:943–949. - PubMed
-
- Beckmann C.F., Mackay C.E., Filippini N., Smith S.M. OHBM; 2009. Group Comparison of Resting-state FMRI Data Using Multi-subject ICA and Dual Regression.
-
- Beckmann C.F., Smith S.M. Probabilistic independent component analysis for functional magnetic resonance imaging. IEEE Trans. Med. Imaging. 2004;23:137–152. - PubMed
-
- Birn R.M., Diamond J.B., Smith M.A., Bandettini P.A. Separating respiratory-variation-related fluctuations from neuronal-activity-related fluctuations in fMRI. NeuroImage. 2006;31:1536–1548. - PubMed
MeSH terms
Substances
Grants and funding
LinkOut - more resources
Full Text Sources
Other Literature Sources
Medical
Miscellaneous
