

Forecasted trends in disability and life expectancy in England and Wales up to 2025: a modelling study
- PMID: 28736759
- PMCID: PMC5500313
- DOI: 10.1016/S2468-2667(17)30091-9
Forecasted trends in disability and life expectancy in England and Wales up to 2025: a modelling study
Abstract
Background: Reliable estimation of future trends in life expectancy and the burden of disability is crucial for ageing societies. Previous forecasts have not considered the potential impact of trends in disease incidence. The present prediction model combines population trends in cardiovascular disease, dementia, disability, and mortality to forecast trends in life expectancy and the burden of disability in England and Wales up to 2025.
Methods: We developed and validated the IMPACT-Better Ageing Model-a probabilistic model that tracks the population aged 35-100 years through ten health states characterised by the presence or absence of cardiovascular disease, dementia, disability (difficulty with one or more activities of daily living) or death up to 2025, by use of evidence-based age-specific, sex-specific, and year-specific transition probabilities. As shown in the English Longitudinal Study of Ageing, we projected continuing declines in dementia incidence (2·7% per annum), cardiovascular incidence, and mortality. The model estimates disability prevalence and disabled and disability-free life expectancy by year.
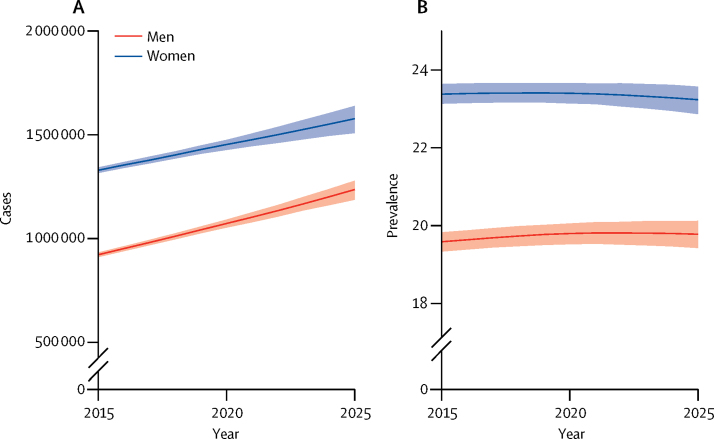
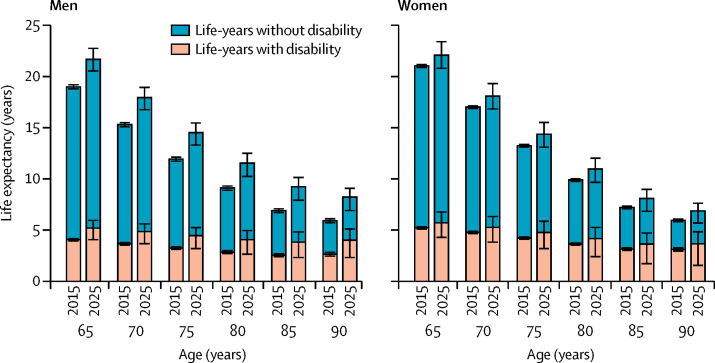
Findings: Between 2015 and 2025, the number of people aged 65 years and older will increase by 19·4% (95% uncertainty interval [UI] 17·7-20·9), from 10·4 million (10·37-10·41 million) to 12·4 million (12·23-12·57 million). The number living with disability will increase by 25·0% (95% UI 21·3-28·2), from 2·25 million (2·24-2·27 million) to 2·81 million (2·72-2·89 million). The age-standardised prevalence of disability among this population will remain constant, at 21·7% (95% UI 21·5-21·8) in 2015 and 21·6% (21·3-21·8) in 2025. Total life expectancy at age 65 years will increase by 1·7 years (95% UI 0·1-3·6), from 20·1 years (19·9-20·3) to 21·8 years (20·2-23·6). Disability-free life expectancy at age 65 years will increase by 1·0 years (95% UI 0·1-1·9), from 15·4 years (15·3-15·5) to 16·4 years (15·5-17·3). However, life expectancy with disability will increase more in relative terms, with an increase of roughly 15% from 2015 (4·7 years, 95% UI 4·6-4·8) to 2025 (5·4 years, 4·7-6·4).
Interpretation: The number of older people with care needs will expand by 25% by 2025, mainly reflecting population ageing rather than an increase in prevalence of disability. Lifespans will increase further in the next decade, but a quarter of life expectancy at age 65 years will involve disability.
Funding: British Heart Foundation.
Figures
Comment in
-
The future burden of disability in the UK: the time for urgent action is now.Lancet Public Health. 2017 Jul;2(7):e298-e299. doi: 10.1016/S2468-2667(17)30098-1. Epub 2017 May 23. Lancet Public Health. 2017. PMID: 29253453 No abstract available.
References
-
- WHO Life expectancy at age 65 (years) 2015. https://gateway.euro.who.int/en/indicators/hfa-indicators/hfa_55-1050-li... (accessed Feb 2, 2016).
-
- Van Gool C, Picavet H, Deeg D. Trends in activity limitations: the Dutch older population between 1990 and 2007. Int J Epidemiol. 2011;40:1056–1067. - PubMed
-
- Murray CJL, Richards MA, Newton JN. UK health performance: findings of the Global Burden of Disease Study 2010. Lancet. 2013;381:997–1020. - PubMed
Grants and funding
LinkOut - more resources
Full Text Sources
Other Literature Sources
