

Comparison of PASL, PCASL, and background-suppressed 3D PCASL in mild cognitive impairment
- PMID: 28737289
- PMCID: PMC5593784
- DOI: 10.1002/hbm.23732
Comparison of PASL, PCASL, and background-suppressed 3D PCASL in mild cognitive impairment
Abstract
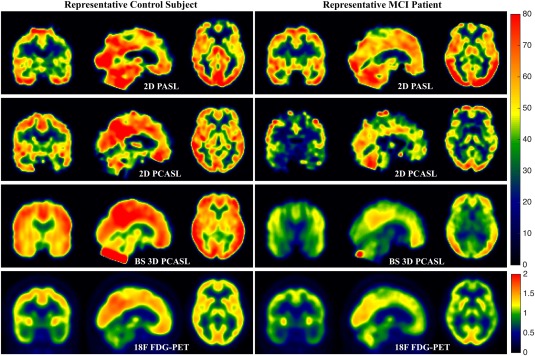
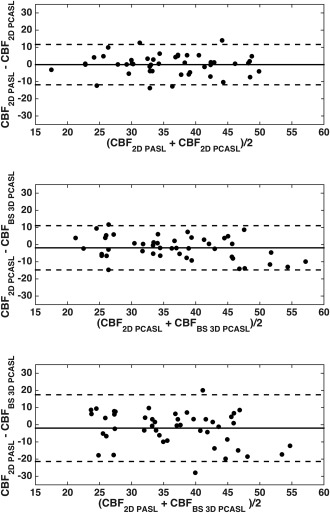
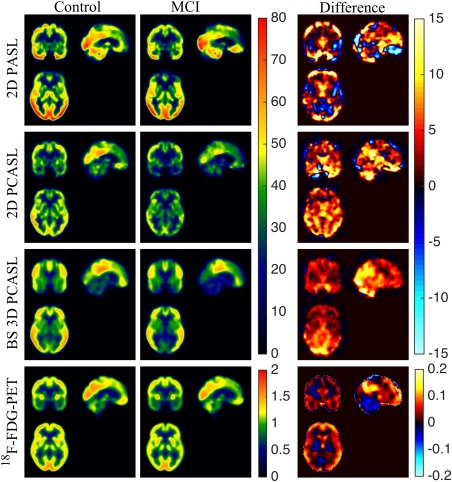
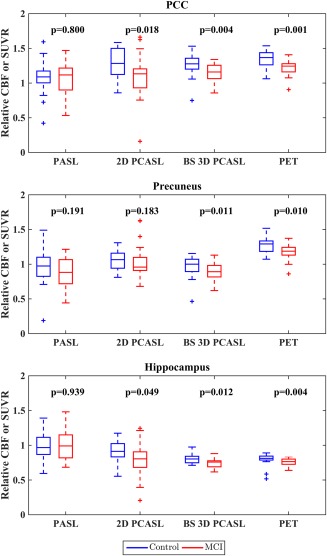
We compared three implementations of single-shot arterial spin labeled (ASL) perfusion magnetic resonance imaging: two-dimensional (2D) pulsed ASL (PASL), 2D pseudocontinuous ASL (PCASL), and background-suppressed (BS) 3D PCASL obtained in a cohort of patients with mild cognitive impairment (MCI) and elderly controls. Study subjects also underwent 18 F-fluorodeoxyglucose positron emission tomography (18 F-FDG PET). While BS 3D PCASL showed the lowest (P < 0.001) gray matter-white matter cerebral blood flow (CBF) contrast ratio, it provided the highest (P < 0.001) temporal signal-to-noise ratio. Mean relative CBF estimated using the PCASL methods in posterior cingulate cortex (PCC), precuneus, and hippocampus showed hypoperfusion in the MCI cohort compared to the controls consistent with hypometabolism measured by 18 F-FDG PET. BS 3D PCASL demonstrated the highest discrimination between controls and patients with effect size comparable to that seen with 18 F-FDG PET. 2D PASL did not demonstrate group differentiation with relative CBF in any ROI, whereas 2D PCASL demonstrated significant differences only in PCC and hippocampus. Mean global CBF values did not differ across methods and were highly correlated; however, the correlations were significantly higher (P < 0.001) when either the same labeling (PCASL) or the same acquisition strategy (2D) was used as compared to when both the labeling and readout methods differed. In addition, there were differences in regional distribution of CBF between the three modalities, which can be attributed to differences in sequence parameters. These results demonstrate the superiority of ASL with PCASL and BS 3D readout as a biomarker for regional brain function changes in MCI. Hum Brain Mapp 38:5260-5273, 2017. © 2017 Wiley Periodicals, Inc.
Keywords: 3D spiral acquisition; background suppression; mild cognitive impairment; positron emission tomography; pseudocontinuous ASL; pulsed ASL.
© 2017 Wiley Periodicals, Inc.
Conflict of interest statement
There is no financial interest in relation to the work described in this paper.
Figures
References
-
- Alsop DC, Detre JA, Golay X, Gunther M, Hendrikse J, Hernandez‐Garcia L, Lu H, Macintosh BJ, Parkes LM, Smits M, van Osch MJ, Wang DJ, Wong EC, Zaharchuk G (2015): Recommended implementation of arterial spin‐labeled perfusion MRI for clinical applications: A consensus of the ISMRM perfusion study group and the European consortium for ASL in dementia. Magn Reson Med 73:102–116. - PMC - PubMed
-
- Alsop DC, Detre JA, Grossman M (2000): Assessment of cerebral blood flow in Alzheimer's disease by spin‐labeled magnetic resonance imaging. Ann Neurol 47:93–100. - PubMed
-
- Ashburner J (2007): A fast diffeomorphic image registration algorithm. NeuroImage 38:95–113. - PubMed
Publication types
MeSH terms
Substances
Grants and funding
LinkOut - more resources
Full Text Sources
Other Literature Sources
Medical
