. 2017 Aug 1;127(8):3136-3151.
doi: 10.1172/JCI91301. Epub 2017 Jul 24.

Astrocytic tight junctions control inflammatory CNS lesion pathogenesis

Affiliations

Astrocytic tight junctions control inflammatory CNS lesion pathogenesis

Sam Horng et al. J Clin Invest. .

Abstract

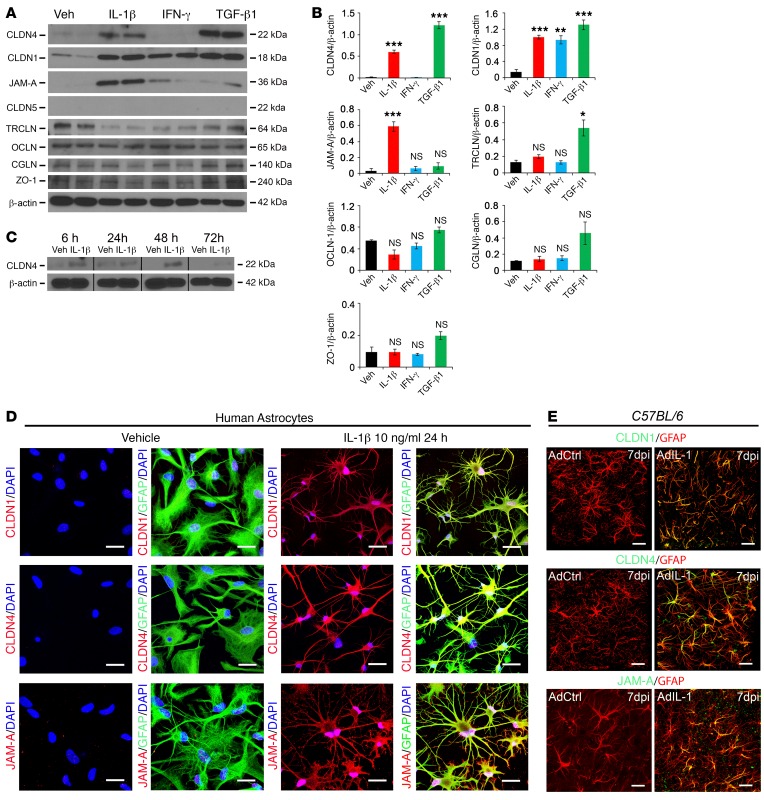
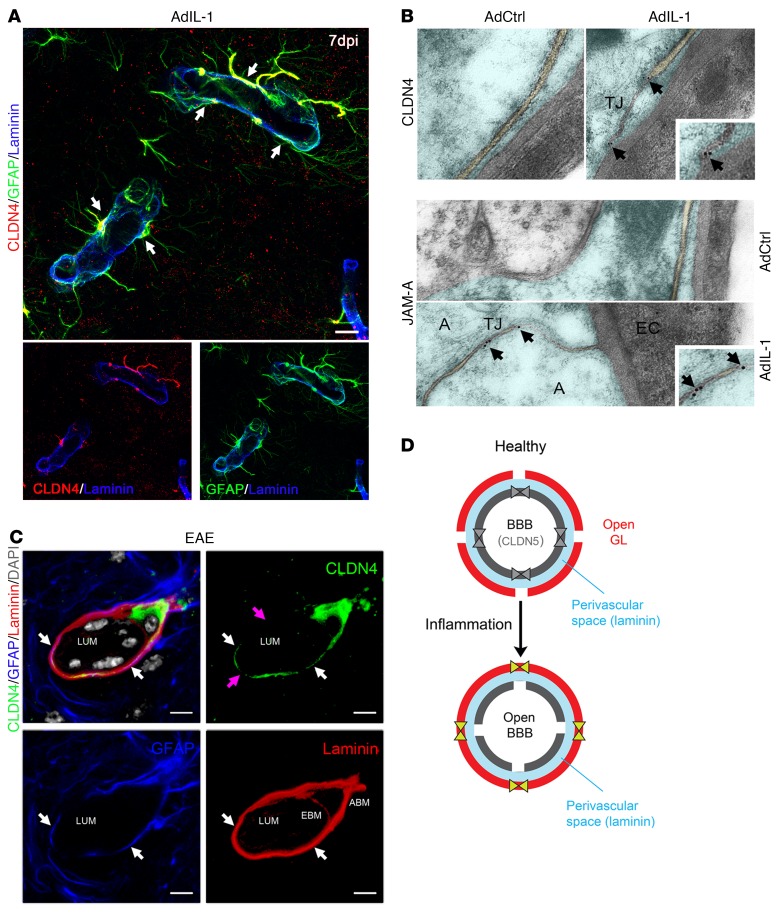
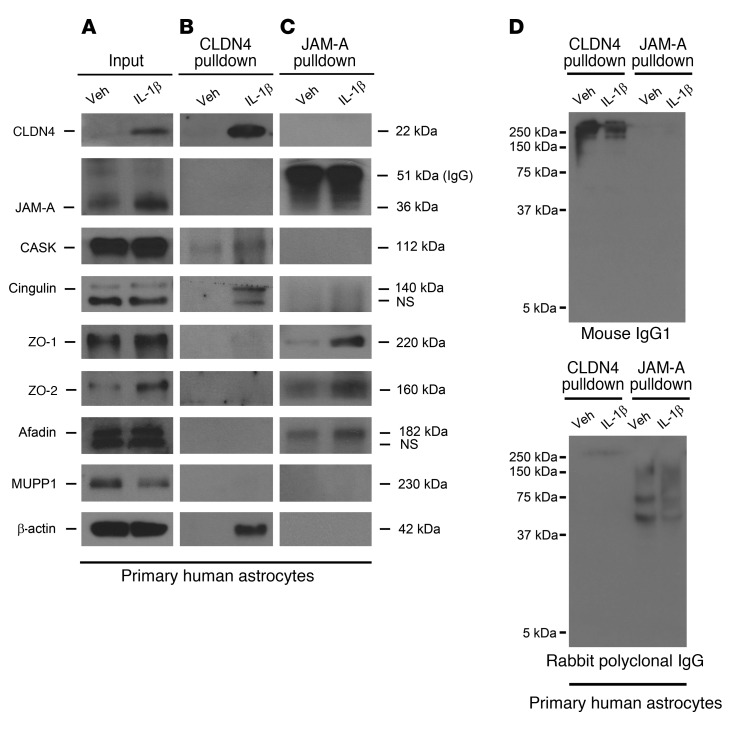
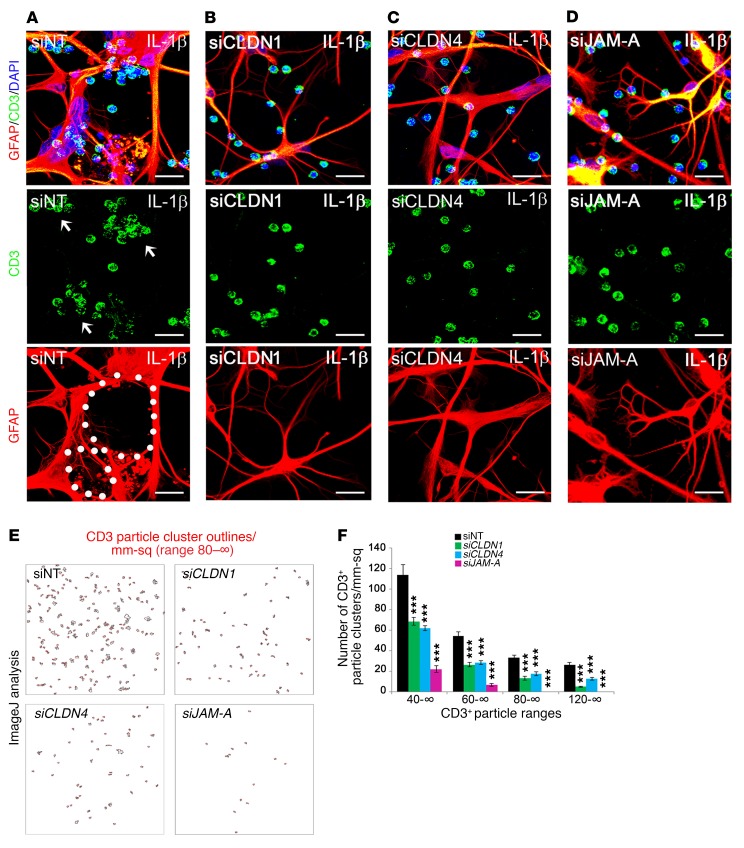
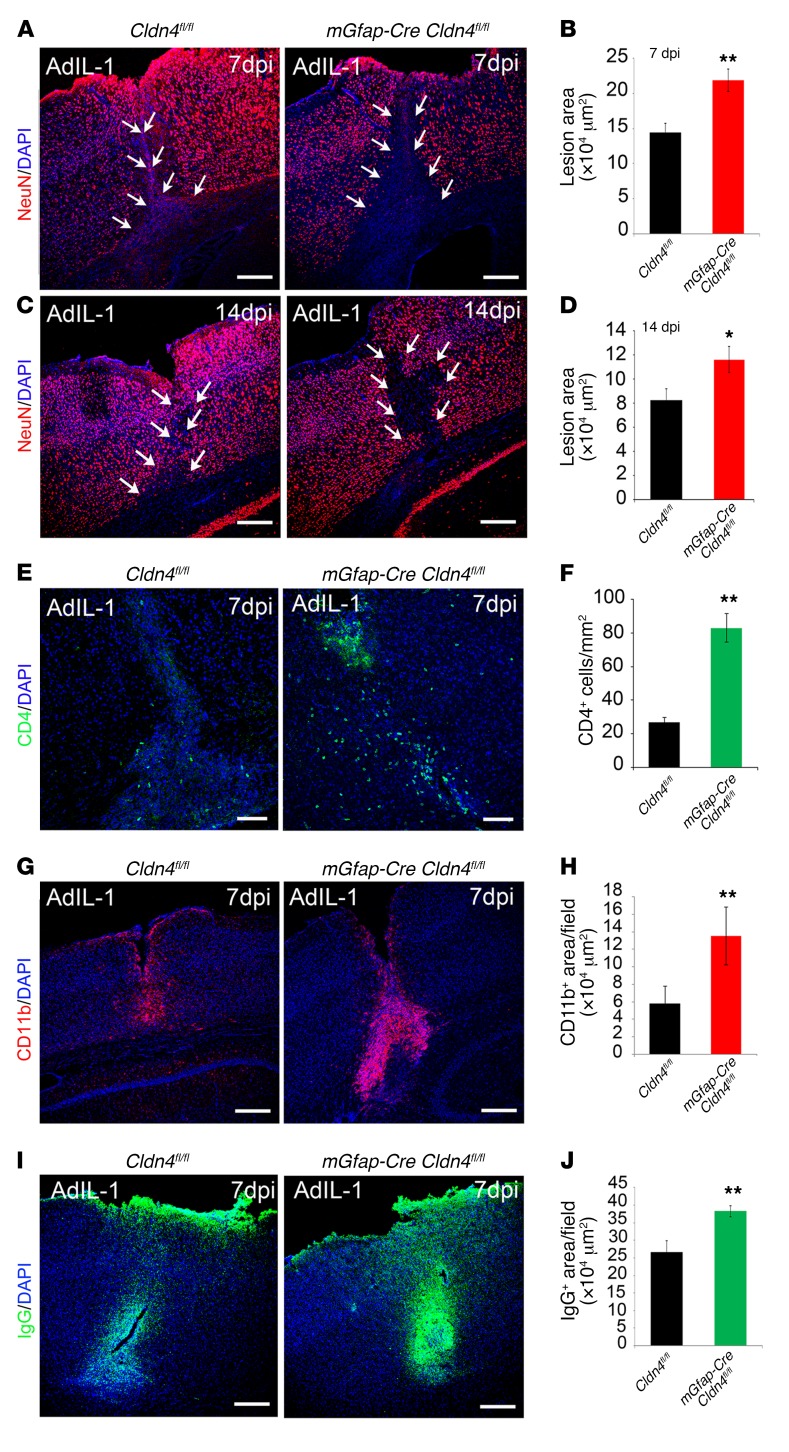
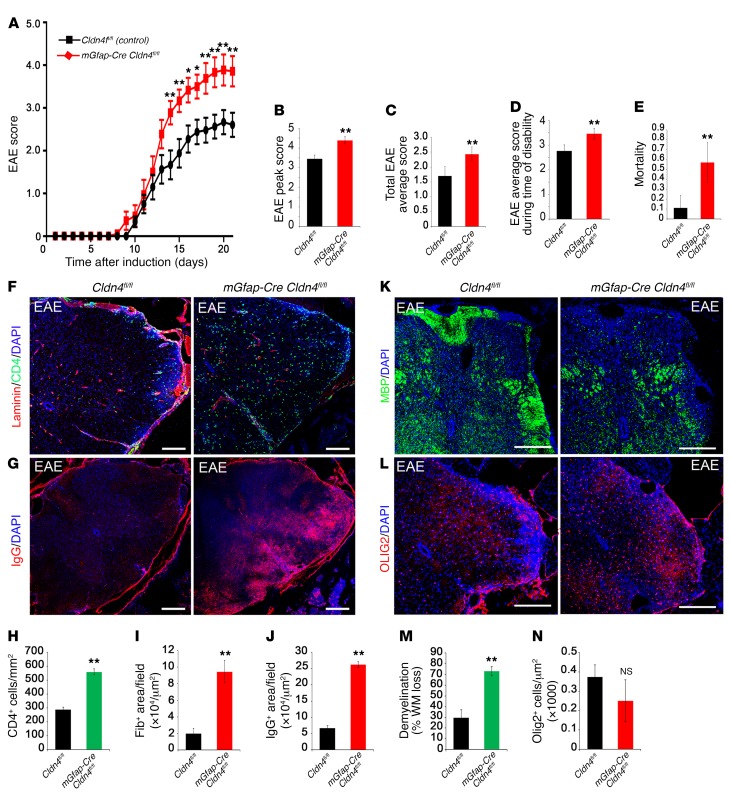
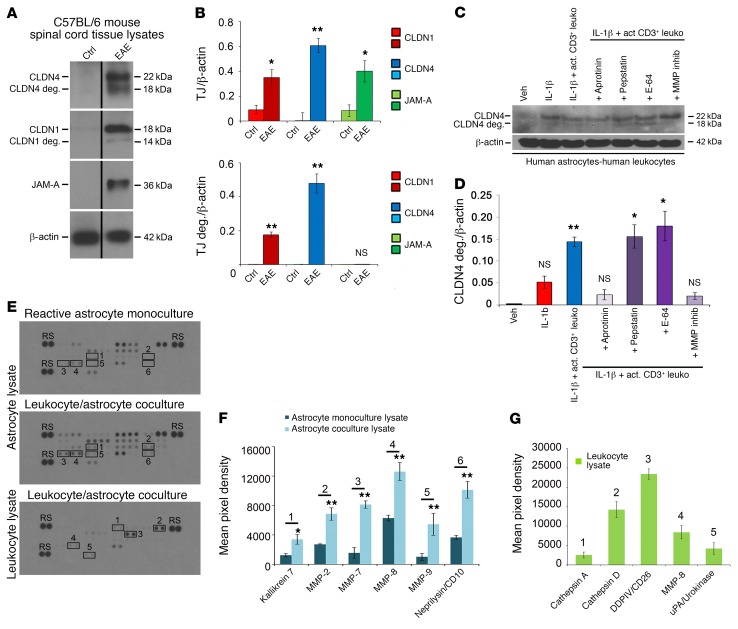
Lesions and neurologic disability in inflammatory CNS diseases such as multiple sclerosis (MS) result from the translocation of leukocytes and humoral factors from the vasculature, first across the endothelial blood-brain barrier (BBB) and then across the astrocytic glia limitans (GL). Factors secreted by reactive astrocytes open the BBB by disrupting endothelial tight junctions (TJs), but the mechanisms that control access across the GL are unknown. Here, we report that in inflammatory lesions, a second barrier composed of reactive astrocyte TJs of claudin 1 (CLDN1), CLDN4, and junctional adhesion molecule A (JAM-A) subunits is induced at the GL. In a human coculture model, CLDN4-deficient astrocytes were unable to control lymphocyte segregation. In models of CNS inflammation and MS, mice with astrocyte-specific Cldn4 deletion displayed exacerbated leukocyte and humoral infiltration, neuropathology, motor disability, and mortality. These findings identify a second inducible barrier to CNS entry at the GL. This barrier may be therapeutically targetable in inflammatory CNS disease.


Conflict of interest statement

Conflict of interest: The authors have declared that no conflict of interest exists.

Figures

Figure 1
Figure 1. Reactive astrocytes upregulate CLDN1, CLDN4, and JAM-A in vitro and in vivo.
(A and B) Western immunoblots (2 replicates depicted) (A) and mean values of densitometric quantification of immunoblot band intensities (from 3 biological replicates) (B) from cultured human astrocytes treated with 10 ng/ml IL-1β, IFN-γ, or TGF-β1 for 24 hours. CLDN1, CLDN4, and JAM-A are all induced by IL-1β, and CLDN1 and CLDN4 are also induced by TGF-β1. The TJ-associated protein tricellulin is induced by TGF-β1 alone. CLDN5 is not expressed by astrocytes. See also Supplemental Figure 1, A and B. (C) Following treatment with 10 ng/ml IL-1β, CLDN4 induction begins at 6 hours, is maintained at 24 and 48 hours, and decreases at 72 hours. (D) Immunostaining of human astrocyte cultures demonstrates that IL-1β induces expression of CLDN1, CLDN4, and JAM-A (red), which localize to the cell membranes of cells positive for the astrocyte marker GFAP. Scale bars: 20 μm. (E) In control C57BL/6 mice, cortical microinjection in vivo of adenovirus expressing IL-1 (AdIL-1), but not a control sequence, AdDL70 (AdCtrl), induces reactive astrocyte morphology and upregulation of CLDN1, CLDN4, and JAM-A at 7 days postinjection (7 dpi). Images are 3-dimensionally rendered projections. Scale bars: 40 μm. Data are representative of findings from 3 (AC, and E) or more than 3 (D) biological replicates. *P < 0.05, **P < 0.01, ***P < 0.001.
Figure 2
Figure 2. CLDN4 and JAM-A are expressed within TJ strands of reactive astrocytes in vivo.
(A) Immunostaining within an AdIL-1 lesion at 7 dpi for GFAP (green), the basement membrane marker pan-laminin (blue), and the astrocytic TJ protein CLDN4 (red) demonstrates CLDN4 expression at reactive astrocytic endfeet surrounding the vasculature (arrows). Scale bar: 10 μm. See also Supplemental Figure 1C. (B) Transmission electron microscopy of astrocytic endfeet within cortical AdIL-1 and AdCtrl injection sites demonstrates TJs in AdIL-1 lesions but not in controls. Immunogold staining shows colocalization of CLDN4 and JAM-A to the TJ structures (arrows point to gold particles). A, astrocyte; EC, endothelial cell. Original magnification, ×10,000. (C) Immunostaining within an EAE lesion at 21 days for GFAP (blue), pan-laminin (red), and CLDN4 (green) demonstrates the structural organization of the reactive GL. This cross section shows basement membranes of the endothelial BBB (EBM) and astrocytic GL (ABM), demarcated by pan-laminin staining and differentiated by astrocytic endfeet, stained by GFAP and CLDN4. Leukocytes, identified in gray based on morphologic features and DAPI nuclear staining, are seen within the endothelial lumen (LUM) and PVS. White arrows highlight colocalization of CLDN4 and GFAP; pink arrows indicate areas of irregular CLDN4 staining, possibly reflecting irregularities of expression in the plane of staining or degradation in proximity to leukocytes. Scale bars: 10 μm. See also Supplemental Figure 1, D and E. (D) Schematic of the endothelial BBB and astrocytic GL in health and inflammatory disease. Under healthy conditions, endothelial cells express TJ proteins CLDN5 and occludin (OCLN), which reinforce a closed BBB. In response to inflammation, CLDN5 and OCLN are downregulated, opening the BBB. In turn, astrocytes of the GL upregulate TJ proteins CLDN1, CLDN4, and JAM-A, closing the GL and restricting incoming leukocytes to the PVS (blue). Data are representative of findings from at least 3 (AC) biological replicates.
Figure 3
Figure 3. CLDN4 and JAM-A coimmunoprecipitate with canonical TJ complex proteins.
(AC) Immunoprecipitation of cell lysates from cultured human astrocytes under control and IL-1β–treated conditions reveals that CLDN4 and JAM-A bind different patterns of intracellular TJ adaptor proteins. (A) Cell lysate inputs confirm that astrocytes upregulate JAM-A and CLDN4 after IL-1β treatment and express a variety of intracellular TJ adaptor proteins at baseline and under IL-1β–treated conditions. (B) CLDN4 associates with cingulin, CASK, ZO-1 (the latter weakly), and β-actin. (C) JAM-A complexes with an overlapping but slightly different array of TJ-associated proteins, including ZO-1, ZO-2, afadin, and cingulin (the latter weakly). Interestingly, and compatible with previous reports (30), CLDN4 and JAM-A do not coimmunoprecipitate with each other, suggesting that the 2 proteins do not associate directly and, if connected at all, are linked via weaker bonds of intermediary proteins. (D) Nonspecific isotype control mouse IgG1 and polyclonal rabbit IgG do not show signal at the molecular weights corresponding to TJ-associated proteins of interest, confirming that antibodies for TJ adaptor proteins are specific. Data are representative of findings from more than 3 biological replicates (AD).
Figure 4
Figure 4. Silencing of astrocytic CLDN1, CLDN4, and JAM-A in vitro disrupts lymphocyte clustering.
(AD) Primary human astrocytes were nucleofected with siRNA for CLDN1, CLDN4, JAM-A, or nontargeting (NT) control, then exposed to 10 ng/ml IL-1β (see also Supplemental Figure 2A). After 24 hours, astrocytes were washed and CD3+ T lymphocytes added for coculture for 24–48 hours. Scale bars: 75 μm. (A) Under control conditions, astrocytes extend interconnected processes that surround and corral lymphocytes into clusters (white arrows point to cell clusters, white dots outline interconnected astrocytic processes). (BD) In cultures with silenced CLDN1, CLDN4, or JAM-A, there are fewer interconnected processes, and lymphocytes are distributed more diffusely throughout the coculture. (E and F) Compared with siNT controls, there is a significant decrease in the number of clusters containing greater than 40, 60, 80, and 120 cells in siCLDN1-, siCLDN4-, and siJAM-A–treated cultures (n = 3 per group, P < 0.00005, 1-way ANOVA with Bonferroni correction). Data are representative of 3 independent experiments in separate cultures. See also Supplemental Figure 2, B–F. ***P < 0.001.
Figure 5
Figure 5. Conditional astrocyte Cldn4 inactivation exacerbates the size of inflammatory CNS lesions.
Cortical AdIL-1 microinjection produces asymptomatic inflammatory lesions characterized by leukocyte (predominantly CD4+ and CD11b+ cell) and humoral factor parenchymal entry, accompanied by reactive astrogliosis and neuronal death. Lesion pathogenesis peaks at 7 dpi and is resolving by 14 dpi. (AD) Compared with controls, Cldn4 CKO mice display increased AdIL-1 lesion size, as measured by the area of neuronal cell death (NeuN loss), at 7 dpi and 14 dpi (7 dpi: n = 12 CKO, n = 15 WT, P < 0.005; 14 dpi: n = 5 CKO, n = 8 WT, P < 0.05, 2-tailed t test). Scale bars: 300 μm. (EH) At 7 dpi, lesions of Cldn4 CKO mice have increased numbers of CD4+ lymphocytes (n = 10 CKO, n = 10 WT, P < 0.01, 2-tailed t test) (E and F) and level of CD11b+ staining (n = 6 CKO, n = 9 WT, P < 0.005, 2-tailed t test) (G and H). (I and J) At 7 dpi, lesions of Cldn4 CKO mice show increased areas of IgG entry (n = 8 KO, n = 11 WT, P < 0.01, 2-tailed t test). See also Supplemental Figure 3, A–G. *P < 0.05, **P < 0.01.
Figure 6
Figure 6. Clinical disability and mortality in EAE are more severe in Cldn4 CKO mice than controls.
(A) Experimental Cldn4 CKO and control mice induced with EAE were scored daily on a standard 5-point scale (29). Disability scores are significantly more severe for CKO mice at days 14–21; *P < 0.05, **P < 0.01, 2-way ANOVA with Bonferroni correction. (B) Peak score during EAE is increased in Cldn4 CKO mice compared with controls (CKO n = 18, WT n = 24, P < 0.01, 2-tailed t test). (CE) Also increased in Cldn4 CKO are average EAE disability score from days 7 to 21 (CKO n = 18, WT n = 24, P < 0.005) (C), average score during time of disability (CKO n = 18, WT n = 23, P < 0.05) (D), and mortality or severe paralysis requiring euthanasia (score ≥4; P < 0.005) (E). There was no difference between groups in rate of EAE induction (P = 0.32, data not shown). (FJ) Spinal cord EAE lesions harvested at 21 dpi or at the time of euthanasia demonstrate increased CD4+ cell infiltration (CKO n = 3, WT n = 6, P < 0.01, 2-tailed t test) (F and H) and increased fibrinogen (CKO n = 4, WT n = 4, P < 0.05) and IgG entry (CKO n = 4, WT n = 3, P < 0.005) (G, I, and J) in Cldn4 CKO mice compared with controls. Data for CD4+ cells were confirmed using flow cytometry (Supplemental Figure 4, A and B) with no difference in counts from the spleen (Supplemental Figure 4, C and D). Infiltrating inflammatory cells in Cldn4 CKO mice showed more parenchymal access past the glia limitans superficialis and perivascular spaces compared with controls (Supplemental Figure 4, E and F). (K and M) Demyelination in EAE lesions, as measured by loss of myelin basic protein (MBP), which represents the percentage of white matter loss (% WM loss) within the dorsolateral (corticospinal motor) tracts, is strikingly increased in Cldn4 CKO mice compared with controls (CKO n = 4, WT n = 4, P < 0.005). (L and N) Oligodendrocyte numbers within EAE lesions are not significantly different between groups (CKO n = 3, WT n = 3, P = 0.25). Scale bars: 300 μm (F and G), 500 μm (K and L). See also Supplemental Figure 4, H–K. *P < 0.05, **P < 0.01.
Figure 7
Figure 7. Astrocytic CLDN4 is degraded in EAE lesions and in coculture with activated CD3+ lymphocytes in vitro.
(A and B) Immunoblotting (A) and densitometric quantification (B) of spinal cord lysates from C57BL/6 mice with EAE (score 2–3, from 18–21 days) and age- and sex-matched controls demonstrate induction of CLDN1, CLND4, and JAM-A in EAE (A and B, upper panel), along with degradation products of CLDN1 and CLDN4 (14 kDa and 18 kDa), but not JAM-A (A and B, lower panel). (C and D) Immunoblotting and densitometry of cocultures of reactive human astrocytes (IL-1β–treated followed by washout) with activated CD3+ lymphocytes. Coculture leads to degradation of astrocytic CLDN4 by 24 hours, and CLDN4 degradation is blocked by specific protease inhibitors, including the serine protease inhibitor aprotinin, and by MMP inhibitor-2. In contrast, degradation is not blocked by the cysteine protease inhibitor E-64, or the aspartic protease inhibitor pepstatin. These studies collectively suggest combinations of kallikrein and urokinase (substrates of aprotinin) and MMP-1, -3, -7, and -9 (substrates of MMP inhibitor-2) as potentially responsible for CLDN1 and CLDN4 digestion (see also Supplemental Figure 5, A–C). (EG) Human astrocytes were pretreated for 24 hours with 10 mg/ml IL-1β, then washed and cultured alone or with activated CD3+ cells for 72 hours. Supernatant and cell lysates of isolated astrocytes or leukocytes were then harvested and applied to protease arrays (3 biological replicates of each condition) (E and F). Astrocyte lysates from coculture with CD3+ cells showed upregulation of kallikrein 7, MMP-2, -7, -8, and -9, and CD10 compared with lysate from monoculture (n = 3 each group, 2-tailed t test, P < 0.05). (E and G) CD3+ cell lysates from coculture demonstrated strongest expression of cathepsins A and D, DDPIV, MMP-8, and uPA. See also Supplemental Figure 5, D and E. Data in AG are representative of findings from 3 or more biological replicates. *P < 0.05, **P < 0.01.

Comment in

  • Astrocytes to the rescue! Glia limitans astrocytic endfeet control CNS inflammation doi: 10.1172/JCI95769

References

    1. Brück W, Bitsch A, Kolenda H, Brück Y, Stiefel M, Lassmann H. Inflammatory central nervous system demyelination: correlation of magnetic resonance imaging findings with lesion pathology. Ann Neurol. 1997;42(5):783–793. doi: 10.1002/ana.410420515. - DOI - PubMed
    1. Miller DH, et al. Serial gadolinium enhanced magnetic resonance imaging in multiple sclerosis. Brain. 1988;111(Pt 4):927–939. - PubMed
    1. Miller DH, et al. High dose steroids in acute relapses of multiple sclerosis: MRI evidence for a possible mechanism of therapeutic effect. J Neurol Neurosurg Psychiatr. 1992;55(6):450–453. doi: 10.1136/jnnp.55.6.450. - DOI - PMC - PubMed
    1. Beck RW, et al. A randomized, controlled trial of corticosteroids in the treatment of acute optic neuritis. The Optic Neuritis Study Group. N Engl J Med. 1992;326(9):581–588. doi: 10.1056/NEJM199202273260901. - DOI - PubMed
    1. Mahad DH, Trapp BD, Lassmann H. Pathological mechanisms in progressive multiple sclerosis. Lancet Neurol. 2015;14(2):183–193. doi: 10.1016/S1474-4422(14)70256-X. - DOI - PubMed

MeSH terms