. 2017 Aug 1;127(8):3152-3166.
doi: 10.1172/JCI92744. Epub 2017 Jul 24.

Thrombin promotes diet-induced obesity through fibrin-driven inflammation

Affiliations

Thrombin promotes diet-induced obesity through fibrin-driven inflammation

Anna K Kopec et al. J Clin Invest. .

Abstract

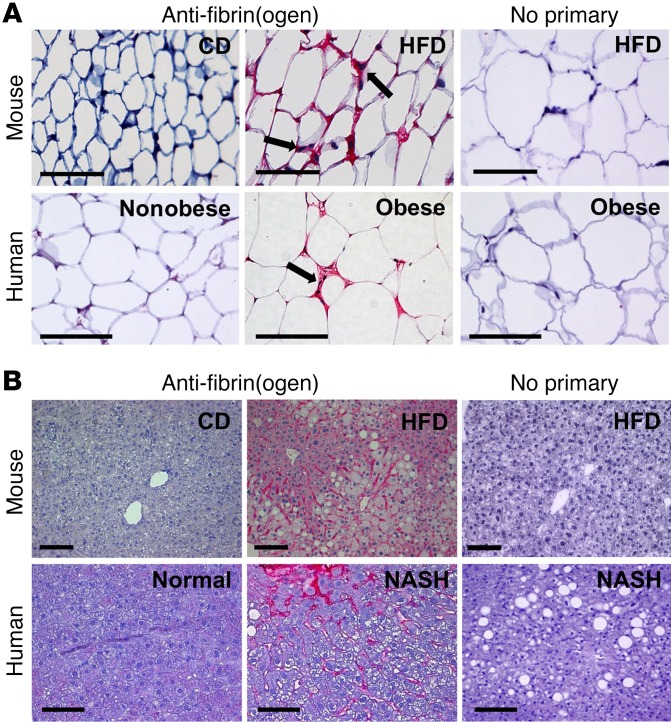
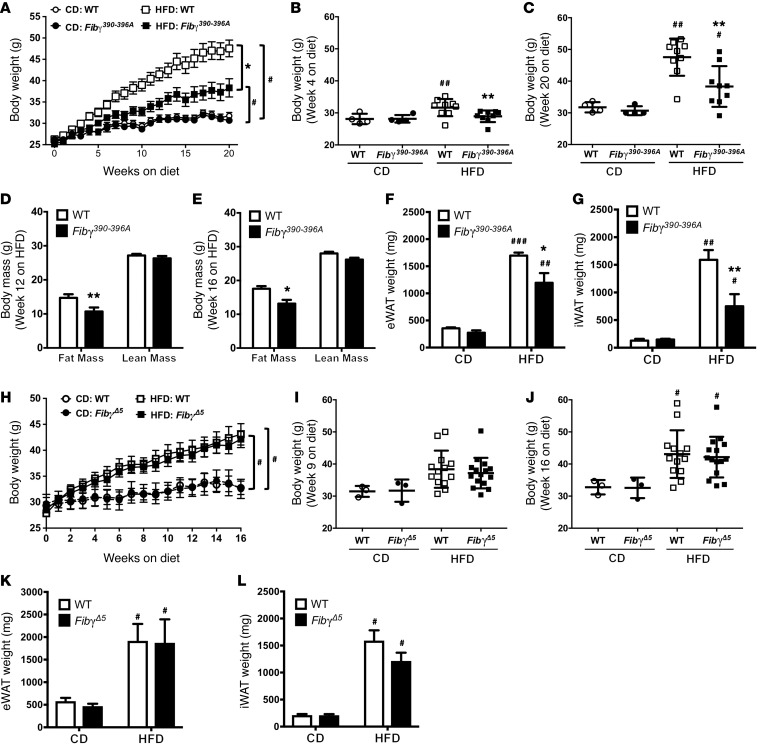
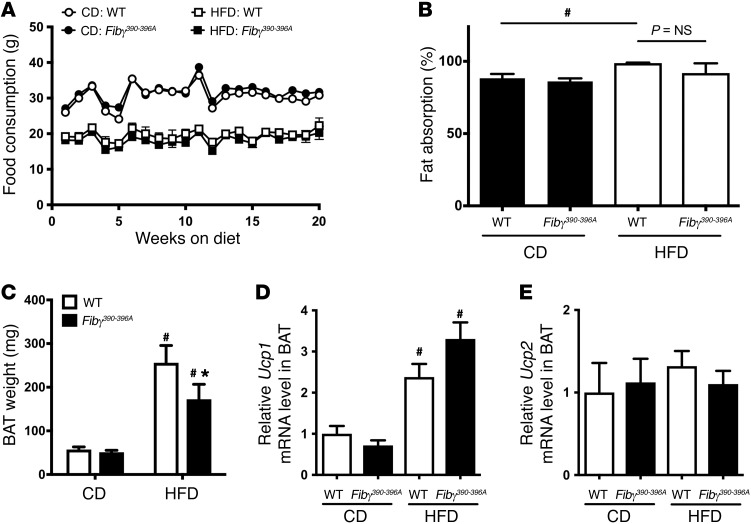
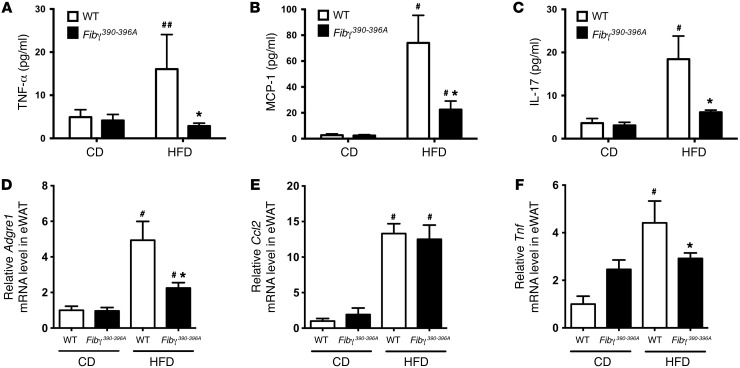
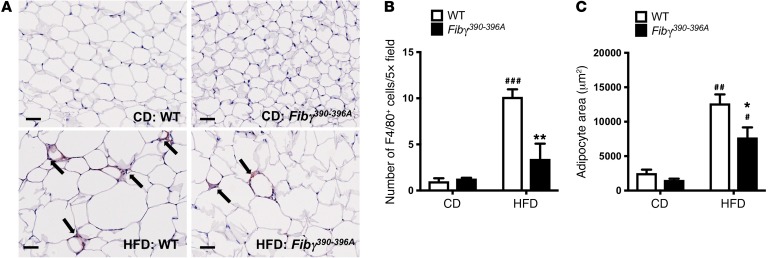
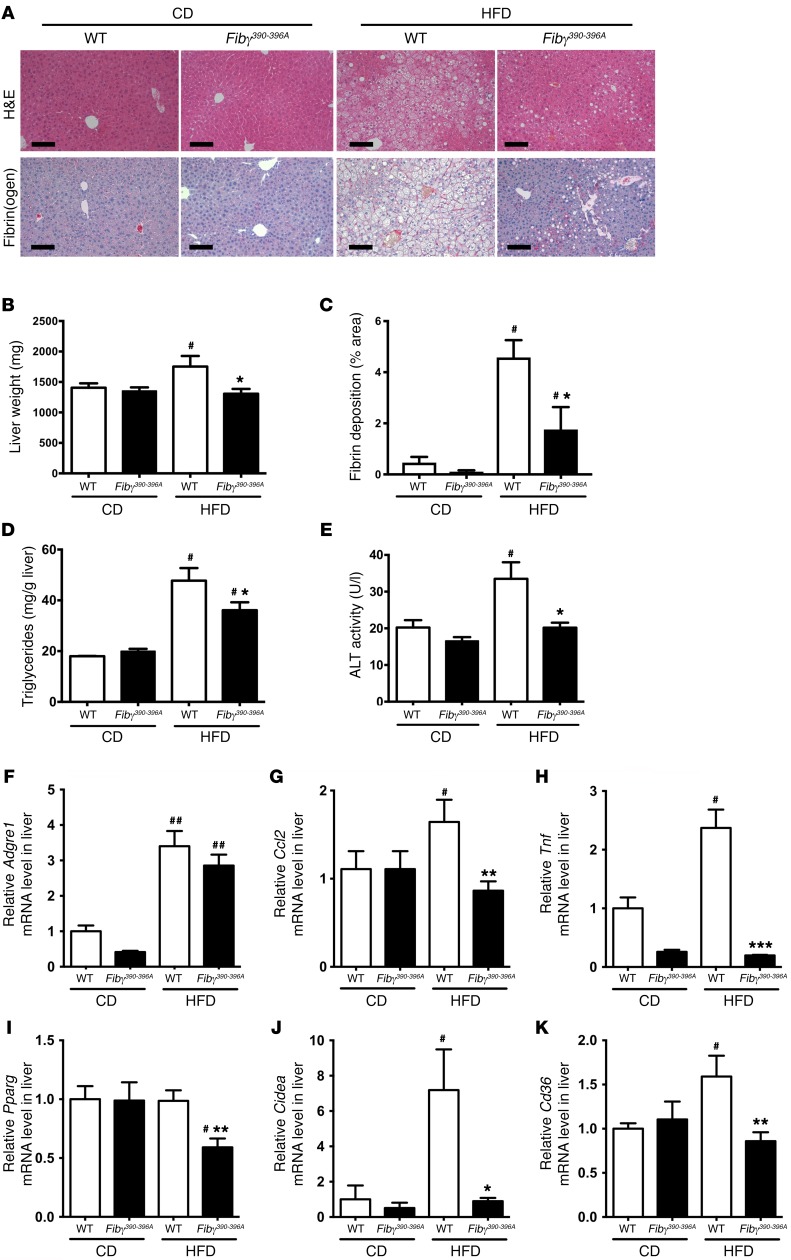
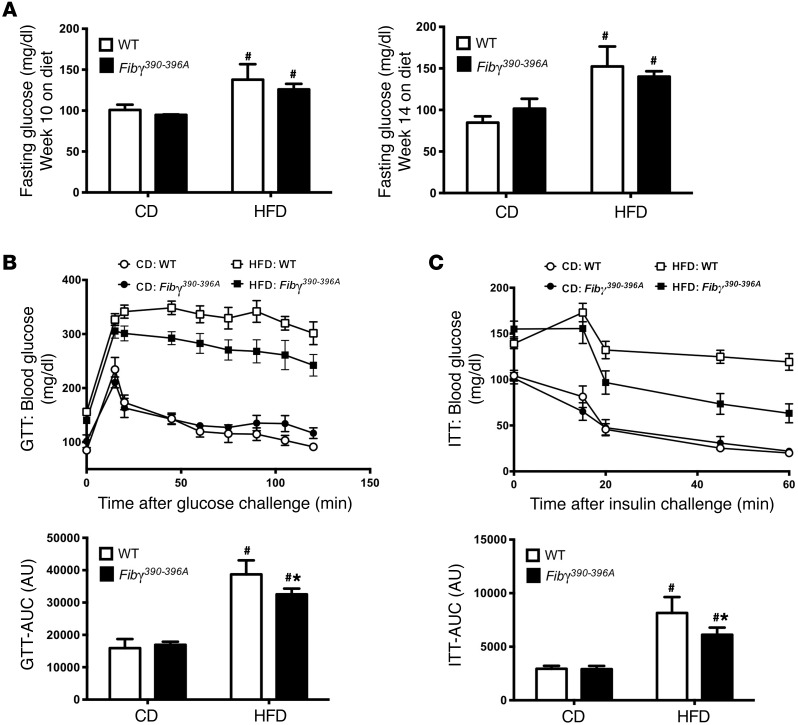
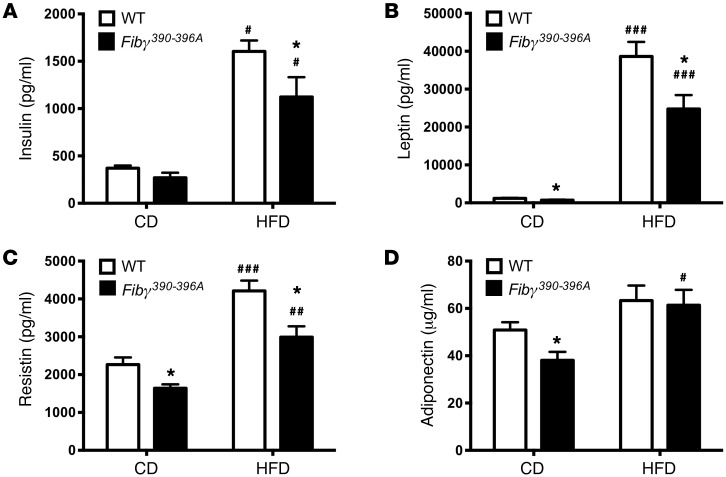
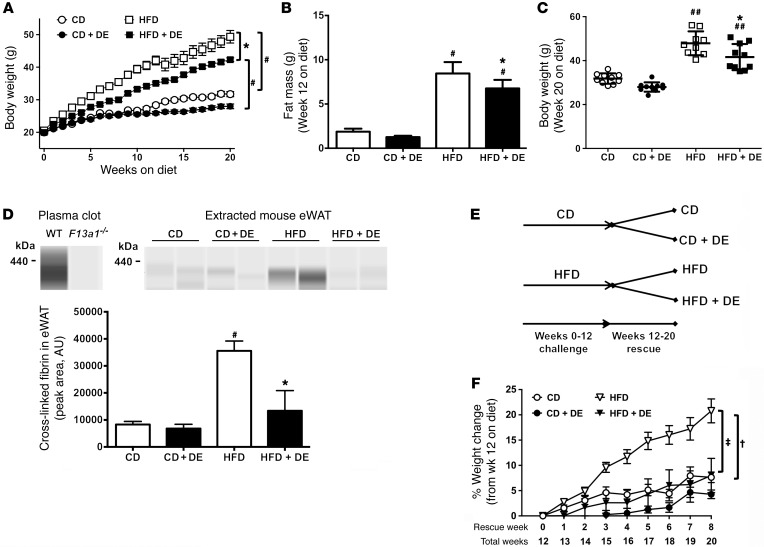
Obesity promotes a chronic inflammatory and hypercoagulable state that drives cardiovascular disease, type 2 diabetes, fatty liver disease, and several cancers. Elevated thrombin activity underlies obesity-linked thromboembolic events, but the mechanistic links between the thrombin/fibrin(ogen) axis and obesity-associated pathologies are incompletely understood. In this work, immunohistochemical studies identified extravascular fibrin deposits within white adipose tissue and liver as distinct features of mice fed a high-fat diet (HFD) as well as obese patients. Fibγ390-396A mice carrying a mutant form of fibrinogen incapable of binding leukocyte αMβ2-integrin were protected from HFD-induced weight gain and elevated adiposity. Fibγ390-396A mice had markedly diminished systemic, adipose, and hepatic inflammation with reduced macrophage counts within white adipose tissue, as well as near-complete protection from development of fatty liver disease and glucose dysmetabolism. Homozygous thrombomodulin-mutant ThbdPro mice, which have elevated thrombin procoagulant function, gained more weight and developed exacerbated fatty liver disease when fed a HFD compared with WT mice. In contrast, treatment with dabigatran, a direct thrombin inhibitor, limited HFD-induced obesity development and suppressed progression of sequelae in mice with established obesity. Collectively, these data provide proof of concept that targeting thrombin or fibrin(ogen) may limit pathologies in obese patients.


Conflict of interest statement

Conflict of interest: A. Goss and J. van Ryn are employees of Boehringer Ingelheim Pharmaceuticals Inc.

Figures

Figure 1
Figure 1. Fibrin(ogen) deposits accumulate in white adipose tissue of HFD-fed mice and obese human patients as well as in liver tissue of HFD-fed mice and patients with NASH.
(A) Fibrin(ogen) immunohistochemical staining (red) of white adipose tissue of mice fed either a control diet (CD) or a 60% high-fat diet (HFD) for 16 weeks as well as visceral adipose tissue of nonobese and obese patients. Note the intense fibrin(ogen) deposits in areas between the hypertrophic adipocytes coincident with macrophages (arrows). (B) Fibrin(ogen) staining (red) of liver tissue from mice fed either a CD or a 60% HFD for 16 weeks as well as from patients with normal liver histology or obese patients with NASH. Scale bars: 100 μm.
Figure 2
Figure 2. Fibγ390–396A, but not FibγΔ5, mice are protected from the development of HFD-driven obesity.
(AG) WT and Fibγ390–396A mice were fed either a CD (n = 4 mice per genotype) or a 60% HFD (n = 9 mice per genotype). (A) Mean body weights of WT and fibrinogen γ390-396A (Fibγ390-396A) mice over a 20-week feeding period. (B and C) Distribution of body weights for WT and Fibγ390–396A mice fed the CD or 60% HFD at week 4 (B) and week 20 (C) on diet. (D and E) Analysis of body mass composition of 60% HFD–fed WT and Fibγ390–396A mice performed at week 12 (D) and week 16 (E). (F and G) Total fat pad weights of eWAT (F) and iWAT (G) for WT and Fibγ390–396A mice at week 20. (H) Mean body weights of WT and fibrinogen γΔ5 (FibγΔ5) mice fed a CD (n = 3 mice per genotype) or 60% HFD (n = 14–15 mice per genotype) over a 16-week feeding period. (I and J) Analysis of individual body weights for WT and FibγΔ5 mice at week 9 (I) and week 16 (J) on diet. (K and L) Total fat pad weights of eWAT (K) and iWAT (L) for WT and FibγΔ5 mice at week 16. Data are expressed as the mean ± SEM. Data were analyzed by 2-way ANOVA with Student-Newman-Keuls post hoc test. *P < 0.05, **P < 0.01 for analyses comparing differences between genotypes on the same diet. #P < 0.05, ##P < 0.01, ###P < 0.001 for analyses comparing differences between diets with mice of the same genotype.
Figure 3
Figure 3. Fibγ390–396A mice consume the same amount of food, have similar intestinal fat absorption, and have reduced brown adipose tissue weight following HFD challenge compared with WT mice.
(A) Food consumption based on weight of food consumed per mouse per week for WT and Fibγ390–396A mice fed a CD (n = 4 per genotype) and a 60% HFD (n = 9 per genotype). (B) Intestinal fat absorption using the behenic acid assay (see Methods) for WT and Fibγ390–396A mice fed either a CD or a 60% HFD for 16 weeks (n = 4 mice per genotype per diet). (C) Brown adipose tissue (BAT) weights of WT and Fibγ390–396A mice fed either a CD (n = 4 mice per genotype) or a 60% HFD (n = 9 mice per genotype). (D and E) Quantitative reverse transcriptase PCR (RT-PCR) analysis of BAT from WT and Fibγ390–396A mice fed a CD or a HFD for Ucp1 (D) or Ucp2 (E). Data are expressed as the mean ± SEM. Data were analyzed by 2-way ANOVA with Student-Newman-Keuls post hoc test. *P < 0.05 for analyses comparing differences between genotypes on the same diet. #P < 0.05 for analyses comparing differences between diets with mice of the same genotype.
Figure 4
Figure 4. Fibγ390–396A mice develop significantly diminished HFD-induced systemic and adipose inflammation.
WT and Fibγ390–396A mice were fed a CD (n = 4 mice per genotype) or a 60% HFD (n = 11–12 mice per genotype) for 20 weeks. (AC) Circulating levels of TNF-α (A), MCP-1 (B), and IL-17 (C) in plasma. (DF) Levels of mRNA in eWAT for the macrophage marker F4/80 (Adgre1) (D), the macrophage chemokine MCP-1 (Ccl2) (E), and the proinflammatory cytokine TNF-α (Tnf) (F) were determined by quantitative RT-PCR. Data are expressed as the mean ± SEM. Data were analyzed by 2-way ANOVA with Student-Newman-Keuls post hoc test. *P < 0.05 for analyses comparing differences between genotypes on the same diet. #P < 0.05, ##P < 0.01 for analyses comparing differences between diets with mice of the same genotype.
Figure 5
Figure 5. Fibγ390–396A mice fed a HFD for 20 weeks have significantly fewer F4/80+ macrophages and reduced adipocyte size relative to HFD-fed WT mice.
(A) Tissue sections of eWAT from WT and Fibγ390–396A mice fed either a CD or a 60% HFD for 20 weeks were stained by immunohistochemistry for the macrophage marker F4/80. Note that F4/80+ cells (arrows) accumulated in “crown-like” structures similar to the fibrin(ogen) deposits shown in Figure 1. Scale bars: 50 μm. (B) Quantification of the number of F4/80+ cells per ×5 high-powered field in eWAT of WT and Fibγ390–396A mice fed CD (n = 3 per genotype) and HFD (n = 5 per genotype). Note that 10 fields were evaluated per sample. (C) Quantification of adipocyte area in the eWAT of WT and Fibγ390–396A mice fed CD (n = 3 per genotype) and HFD (n = 5 per genotype). Note that the area of 50 adipocytes per sample was determined. Data in B and C are presented as mean ± SEM. Data were analyzed by 2-way ANOVA with Student-Newman-Keuls post hoc test. *P < 0.05, **P < 0.01 for analyses comparing differences between genotypes on the same diet. #P < 0.05, ##P < 0.01, ###P < 0.001 for analyses comparing differences between diets with mice of the same genotype.
Figure 6
Figure 6. Fibγ390–396A mice are protected from the development of HFD-driven fatty liver disease and hepatocellular injury.
WT and Fibγ390–396A mice were fed either a CD (n = 4 per genotype) or a 60% HFD (n = 12 per genotype) for 20 weeks. (A) Representative H&E-stained and fibrin(ogen) (red) immunohistochemistry–stained sections of liver tissue. Note that liver tissue from HFD-fed WT mice revealed evidence of hepatic steatosis and sinusoidal fibrin(ogen) deposits. Scale bars: 100 μm. (B) Total liver weights of mice following the 20-week diet challenge. (C) Quantification of fibrin deposits in CD-fed (n = 4 per genotype) and HFD-fed (n = 8 per genotype) WT and Fibγ390–396A mice. Data are presented as the mean ± SEM of the percent area of staining per high-powered field. (D) Analysis of liver triglyceride content confirmed significantly diminished hepatic steatosis in HFD-fed Fibγ390–396A mice relative to WT animals. (E) Analysis of circulating alanine aminotransferase (ALT) in CD- and HFD-fed WT and Fibγ390–396A mice indicated significantly reduced hepatocellular damage in HFD-fed Fibγ390–396A mice. (FK) Hepatic levels of mRNA in liver tissue encoding the genes Adgre1 (F), Ccl2 (G), Tnf (H), Pparg (I), Cidea (J), and Cd36 (K) were determined by quantitative RT-PCR. Data are expressed as the mean ± SEM. Data were analyzed by 2-way ANOVA with Student-Newman-Keuls post hoc test. *P < 0.05, **P < 0.01, ***P < 0.001 for analyses comparing differences between genotypes on the same diet. #P < 0.05, ##P < 0.01 for analyses comparing differences between diets with mice of the same genotype.
Figure 7
Figure 7. Fibγ390–396A mice are protected from HFD-induced glucose dysmetabolism and insulin resistance.
WT and Fibγ390–396A mice were fed a CD (n = 5 mice per genotype) or a 60% HFD (n = 11–12 mice per genotype) for up to 20 weeks. (A) Fasting blood glucose was taken at week 10 and week 14 on diet. (B and C) A glucose tolerance test (GTT) was performed at week 16 on diet (B), and an insulin tolerance test (ITT) was performed at week 18 on diet (C). The AUC was determined for each individual animal for GTT and ITT. Data are presented as the mean ± SEM. Data were analyzed by 2-way ANOVA with Student-Newman-Keuls post hoc test. *P < 0.05 for analyses comparing differences between genotypes on the same diet. #P < 0.05 for analyses comparing differences between diets with mice of the same genotype.
Figure 8
Figure 8. Fibγ390–396A mice have significantly diminished HFD-induced levels of circulating adipokines.
WT and Fibγ390–396A mice were fed a CD (n = 5 mice per genotype) or a 60% HFD (n = 11–12 mice per genotype) for 20 weeks. Mice were fasted 6 hours before collection of plasma and determination of insulin (A), leptin (B), resistin (C), and adiponectin (D) levels. Data are expressed as the mean ± SEM. Data were analyzed by 2-way ANOVA with Student-Newman-Keuls post hoc test. *P < 0.05 for analyses comparing differences between genotypes on the same diet. #P < 0.05, ##P < 0.01, ###P < 0.001 for analyses comparing differences between diets with mice of the same genotype.
Figure 9
Figure 9. Treatment of mice with DE protects against the development of HFD-driven obesity and limits progression of established obesity.
(AC) Mice were fed a CD, a CD formulated with the direct thrombin inhibitor dabigatran etexilate (DE, 7.5 mg/g), a 60% HFD, or a 60% HFD with DE (7.5 mg/g) (n = 9–10 mice per group). (A) Mean body weights of mice over a 20-week feeding period. (B) Body mass composition analysis for fat mass at week 12 on diet. (C) Distribution of body weights at week 20 on diet. (D) Fibrin(ogen) species were detected in clots formed in vitro with plasma from WT and F13a1–/– mice using a capillary Western blot approach. Levels of fibrin(ogen) species were also detected in extracts of eWAT from 20-week CD- and HFD-fed control and DE-treated mice. For quantification, eWAT was used from n = 3–4 mice for CD and n = 7 for HFD. (E and F) WT mice were fed a CD or a 60% HFD for 12 weeks, after which the mice received the same diet for an additional 8 weeks but were randomized to receive diet with or without DE. (E) Summary of experimental design strategy and feeding schedule for the DE rescue experiment. (F) Change in body weight over time for the 8 weeks of DE treatment. Data are expressed as the mean ± SEM. Data were analyzed by 2-way ANOVA with Student-Newman-Keuls post hoc test. *P < 0.05 for analyses comparing differences between HFD and HFD+DE. #P < 0.05, ##P < 0.01 for analyses comparing differences between HFD and CD or between HFD+DE and CD+DE. For the DE intervention study, P < 0.05 for mice fed a HFD versus CD (neither with DE); P < 0.05 for mice on the same diet not treated with DE.

References

    1. Li C, et al. Surveillance of certain health behaviors and conditions among states and selected local areas — Behavioral Risk Factor Surveillance System, United States, 2009. MMWR Surveill Summ. 2011;60(9):1–250. - PubMed
    1. Hotamisligil GS. Inflammation and metabolic disorders. Nature. 2006;444(7121):860–867. doi: 10.1038/nature05485. - DOI - PubMed
    1. Cao H, et al. Regulation of metabolic responses by adipocyte/macrophage fatty acid-binding proteins in leptin-deficient mice. Diabetes. 2006;55(7):1915–1922. doi: 10.2337/db05-1496. - DOI - PubMed
    1. Neels JG, Pandey M, Hotamisligil GS, Samad F. Autoamplification of tumor necrosis factor-α: a potential mechanism for the maintenance of elevated tumor necrosis factor-α in male but not female obese mice. Am J Pathol. 2006;168(2):435–444. doi: 10.2353/ajpath.2006.050699. - DOI - PMC - PubMed
    1. Carolan E, et al. The impact of childhood obesity on inflammation, innate immune cell frequency, and metabolic microRNA expression. J Clin Endocrinol Metab. 2014;99(3):E474–E478. doi: 10.1210/jc.2013-3529. - DOI - PubMed

MeSH terms