. 2017 Sep 1;196(5):638-648.
doi: 10.1164/rccm.201704-0817OC.

Optimization and Interpretation of Serial QuantiFERON Testing to Measure Acquisition of Mycobacterium tuberculosis Infection

Collaborators, Affiliations

Optimization and Interpretation of Serial QuantiFERON Testing to Measure Acquisition of Mycobacterium tuberculosis Infection

Elisa Nemes et al. Am J Respir Crit Care Med. .

Abstract

Rationale: Conversion from a negative to positive QuantiFERON-TB test is indicative of Mycobacterium tuberculosis (Mtb) infection, which predisposes individuals to tuberculosis disease. Interpretation of serial tests is confounded by immunological and technical variability.

Objectives: To improve the consistency of serial QuantiFERON-TB testing algorithms and provide a data-driven definition of conversion.

Methods: Sources of QuantiFERON-TB variability were assessed, and optimal procedures were identified. Distributions of IFN-γ response levels were analyzed in healthy adolescents, Mtb-unexposed control subjects, and patients with pulmonary tuberculosis.

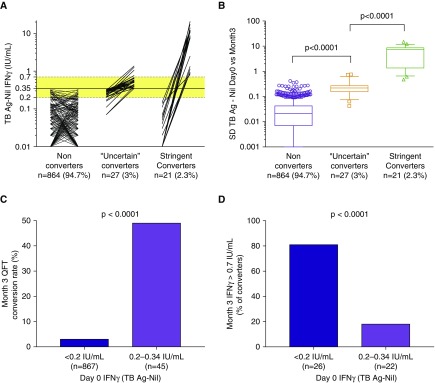
Measurements and main results: Individuals with no known Mtb exposure had IFN-γ values less than 0.2 IU/ml. Among individuals with IFN-γ values less than 0.2 IU/ml, 0.2-0.34 IU/ml, 0.35-0.7 IU/ml, and greater than 0.7 IU/ml, tuberculin skin test positivity results were 15%, 53%, 66%, and 91% (P < 0.005), respectively. Together, these findings suggest that values less than 0.2 IU/ml were true negatives. In short-term serial testing, "uncertain" conversions, with at least one value within the uncertainty zone (0.2-0.7 IU/ml), were partly explained by technical assay variability. Individuals who had a change in QuantiFERON-TB IFN-γ values from less than 0.2 to greater than 0.7 IU/ml had 10-fold higher tuberculosis incidence rates than those who maintained values less than 0.2 IU/ml over 2 years (P = 0.0003). By contrast, "uncertain" converters were not at higher risk than nonconverters (P = 0.229). Eighty-seven percent of patients with active tuberculosis had IFN-γ values greater than 0.7 IU/ml, suggesting that these values are consistent with established Mtb infection.

Conclusions: Implementation of optimized procedures and a more rigorous QuantiFERON-TB conversion definition (an increase from IFN-γ <0.2 to >0.7 IU/ml) would allow more definitive detection of recent Mtb infection and potentially improve identification of those more likely to develop disease.

Keywords: IFN-γ release assay; QuantiFERON; conversion; tuberculosis; variability.


Figures

Figure 1.
Figure 1.
Tuberculin skin test (TST) positivity rates, stratified by QuantiFERON-TB Gold In-Tube (QFT) IFN-γ values. TST and QFT were performed in parallel in cohort 1 (n = 5,357 healthy adolescents). Proportions of adolescents with positive TST results (≥5 mm) were stratified by QFT IFN-γ values at baseline. Purple shading denotes negative test results, and green shading denotes positive test results, according to the assay cutoff at 0.35 IU/ml. IFN-γ values were further stratified according to an uncertainty zone between 0.2 and 0.7 IU/ml. P values were calculated using chi-square tests. Ag = antigen; TB = tuberculosis.
Figure 2.
Figure 2.
Preanalytical variability in QuantiFERON-TB Gold In-Tube (QFT) results relating to blood volume, incubation time, and plasma storage conditions. (A) Variability introduced by incubating different blood volumes (0.8, 1, and 1.2 ml) from eight healthy donors (color coded; from cohort 2) in QFT tubes at 37°C for 16, 20, or 24 hours. Dotted lines denote assay cutoff at IFN-γ values of 0.35 IU/ml. (B) Variability was calculated as median absolute percentage deviation for each participant, considering each condition (i.e., combination of blood volume and incubation time) versus all other conditions. Median absolute percent deviation across all participants is shown, with darker red identifying higher variability (color scale from low [white] to high [red]). (C) Comparison of IFN-γ values in plasma stored at a range of temperatures. Plasma from unstimulated (Nil) or stimulated (Stim) whole blood from healthy donors (n = 3; from cohort 2) was immediately cryopreserved at −80°C or −20°C, kept at 4°C, or incubated at 21°C or 31°C for 3 hours prior to storage at 4°C. IFN-γ values were measured the following day. To assess the impact of freezing/thawing (FT), all samples were then stored at −20°C for 2 weeks, thawed, and analyzed. Symbols denote median and range across triplicate ELISA wells. Ag = antigen; D = donor; TB = tuberculosis.
Figure 3.
Figure 3.
Analytical variability of QuantiFERON-TB Gold In-Tube (QFT) assay. (A and B) Comparison of IFN-γ values of 20 healthy donors in cohort 2, derived using two different sets of IFN-γ standards. IFN-γ standards were reconstituted and diluted according to different QFT package inserts to generate a 4-point standard curve (4 STD; 4, 1, 0.25, and 0 IU/ml) and an 8-point standard curve (8 STD; 8, 4, 2, 1, 0.5, 0.25, 0.125, and 0 IU/ml), which were used in parallel to calculate IFN-γ values for Nil (gray dots), tuberculosis antigen (red dots), and mitogen (purple dots) conditions from each sample (A). The P value was calculated using the Wilcoxon signed-rank test. (B) The dotted line is set at 45 degrees to allow visualization of deviation from equivalence. The r2 value was calculated by linear regression. (C and D) Intraassay variability, depicted as (C) coefficient of variation (%CV) and (D) SD, calculated from triplicate ELISA wells, as a factor of mean IFN-γ concentration in 324 individual QFT samples from cohort 2.
Figure 4.
Figure 4.
QuantiFERON-TB Gold In-Tube (QFT) interassay variability. (A) IFN-γ ELISA variability assessed by longitudinal measurements of three internal quality control (IQC) samples in 150 ELISA assays performed over 18 months by five different operators (indicated by the colors) using three different IFN-γ ELISA batches. Coefficient of variation (CV) and SD across all measurements were calculated for identical IQC plasma samples with low (circles, green text; mean, 0.07 IU/ml), medium (triangles, blue text; mean, 0.52 IU/ml), and high (squares, red text; mean, 1.62 IU/ml) IFN-γ values. (B) Variability between two sequential QFT assays, calculated as SD between IFN-γ values at Day 0 and Month 12 for each individual. QFT was performed according to standard manufacturer’s recommendations in an infant cohort (described in Reference 2) or according to optimized procedures described in Table 1 for cohort 5 (adolescents enrolled in the prevention of Mycobacterium tuberculosis infection trial). All included individuals had negative QFT test results (IFN-γ <0.35 IU/ml) at both time points, did not undergo tuberculin skin testing, and were not diagnosed with incident tuberculosis (TB) disease. Box-and-whisker plots denote median, interquartile range, and 1st–99th percentiles, respectively. P value was calculated by Mann-Whitney U test. The dotted line denotes the SD observed in the lower IQC sample shown in (A), which represents the expected interassay variability solely due to the IFN-γ ELISA used. Ag = antigen.
Figure 5.
Figure 5.
Distribution of IFN-γ values in populations with differential exposure to Mycobacterium tuberculosis (Mtb). (A) Distribution of IFN-γ values among Mtb-unexposed healthy Danish (DK) adults (cohort 3; black; n = 50) and South African (SA) patients with microbiologically confirmed tuberculosis (TB) disease (cohort 4; red; n = 68). (B) Distribution of IFN-γ values in adolescents screened for possible inclusion in the prevention of Mtb infection trial (cohort 5; n = 2,432) based on assay threshold (negative if TB Ag − Nil <0.35 IU/ml, positive if TB Ag − Nil ≥0.35 IU/ml) and uncertainty zone around the threshold (0.2 ≥ TB Ag − Nil ≤ 0.7 IU/ml). The pie chart represents the relative proportions (and numbers) of IFN-γ values falling into the four respective categories indicated by color codes in the histogram. In A and B, the solid vertical lines represent the assay positivity cutoff, and the dotted vertical lines represent the uncertainty zone around the threshold at 0.2 and 0.7 IU/ml. (C) Fold change in IFN-γ values between stimulated (TB Ag) and unstimulated (Nil) blood, stratified by the four categories of IFN-γ values in B. Box-and-whisker plots denote median, interquartile range, and 1st–99th percentiles, respectively. P values were calculated by Mann-Whitney U test. Ag = antigen.
Figure 6.
Figure 6.
Interpretation of serial QuantiFERON-TB Gold In-Tube (QFT) assays. IFN-γ values were measured in adolescents who were QFT negative at screening for the prevention of Mycobacterium tuberculosis infection trial (cohort 5) and retested 3 months thereafter (n = 912) to assess conversion rates in an endemic population. (A) Paired IFN-γ values, from left to right, for adolescents who did not convert (IFN-γ <0.35 IU/ml at both time points), those who converted with one of the two measurements falling in the uncertainty zone (“uncertain” converters), and those who converted from below to above the uncertainty zone (stringent converters). Dotted horizontal lines and yellow shading denote the uncertainty zone (0.2–0.7 IU/ml), and solid line denotes the assay cutoff (0.35 IU/ml). Zeros and negative values have been set to 0.01 to allow visualization on a logarithmic scale. (B) Variability across serial QFT assays, calculated as SD between IFN-γ values at Day 0 and Month 3 for each individual. Box-and-whisker plots denote median, interquartile range, and 10th–90th percentiles, respectively. P values were calculated by Mann-Whitney U test. (C) Month 3 conversion rates, stratified by IFN-γ values at Day 0. (D) Rates of converters with Month 3 IFN-γ values greater than 0.7 IU/ml, stratified by IFN-γ values at Day 0. In C and D, P values were calculated by Fisher’s exact test. Ag = antigen; TB = tuberculosis.

Comment in

References

    1. Machingaidze S, Verver S, Mulenga H, Abrahams DA, Hatherill M, Hanekom W, Hussey GD, Mahomed H. Predictive value of recent QuantiFERON conversion for tuberculosis disease in adolescents. Am J Respir Crit Care Med. 2012;186:1051–1056. - PubMed
    1. Andrews JR, Nemes E, Tameris M, Landry BS, Mahomed H, McClain JB, Fletcher HA, Hanekom WA, Wood R, McShane H, et al. Serial QuantiFERON testing and tuberculosis disease risk among young children: an observational cohort study. Lancet Respir Med. 2017;5:282–290. - PMC - PubMed
    1. World Health Organization (WHO) Guidelines on the management of latent tuberculosis infection. Geneva, Switzerland: WHO; 2015. - PubMed
    1. Pai M, Denkinger CM, Kik SV, Rangaka MX, Zwerling A, Oxlade O, Metcalfe JZ, Cattamanchi A, Dowdy DW, Dheda K, et al. Gamma interferon release assays for detection of Mycobacterium tuberculosis infection. Clin Microbiol Rev. 2014;27:3–20. - PMC - PubMed
    1. Tagmouti S, Slater M, Benedetti A, Kik SV, Banaei N, Cattamanchi A, Metcalfe J, Dowdy D, van Zyl Smit R, Dendukuri N, et al. Reproducibility of interferon gamma (IFN-γ) release assays: a systematic review. Ann Am Thorac Soc. 2014;11:1267–1276. - PMC - PubMed

Publication types

Substances