. 2017 Apr 7;2(10):eaal5237.
doi: 10.1126/sciimmunol.aal5237.

Distinct oxysterol requirements for positioning naïve and activated dendritic cells in the spleen

Affiliations

Distinct oxysterol requirements for positioning naïve and activated dendritic cells in the spleen

Erick Lu et al. Sci Immunol. .

Abstract

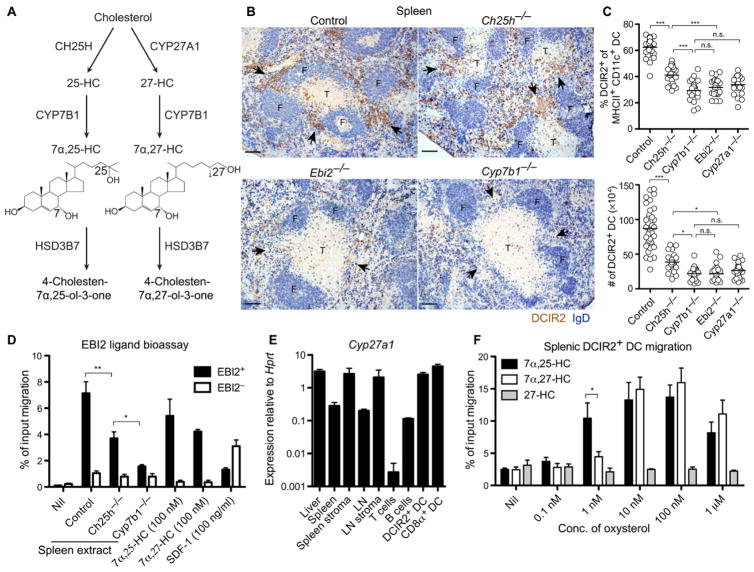
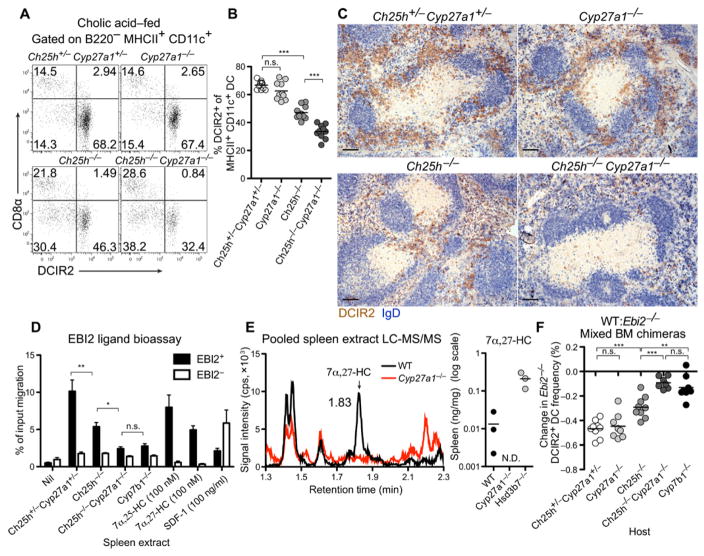
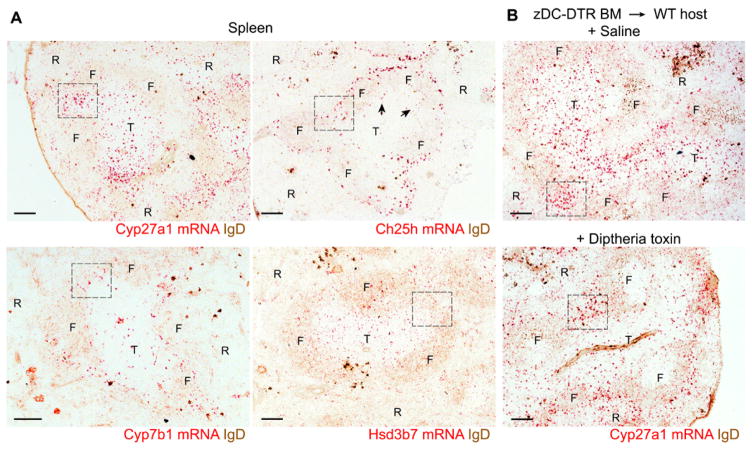
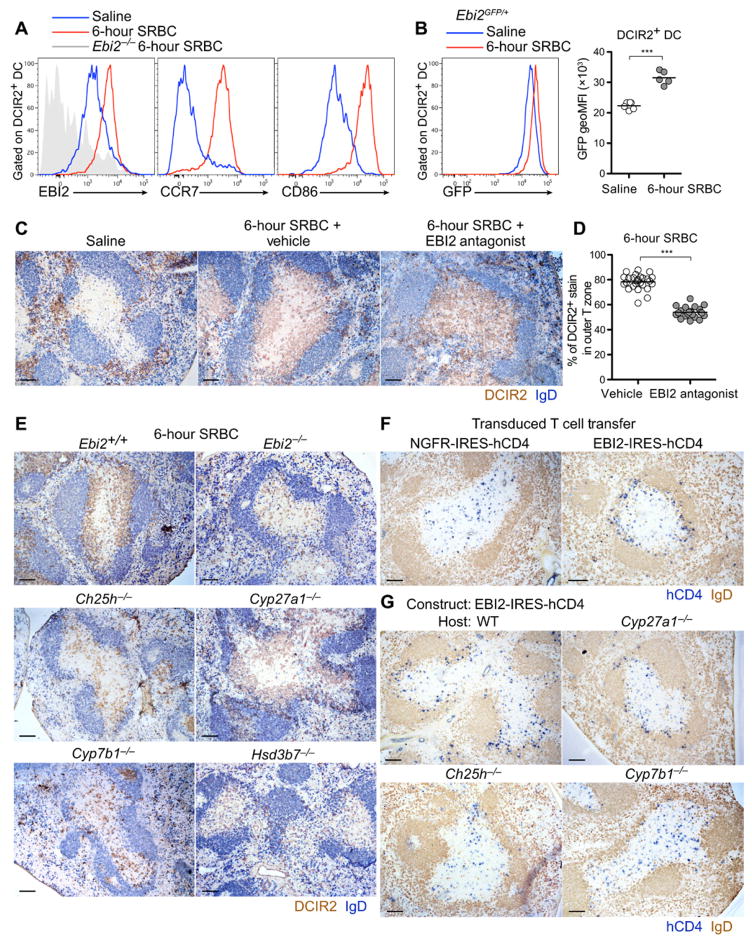
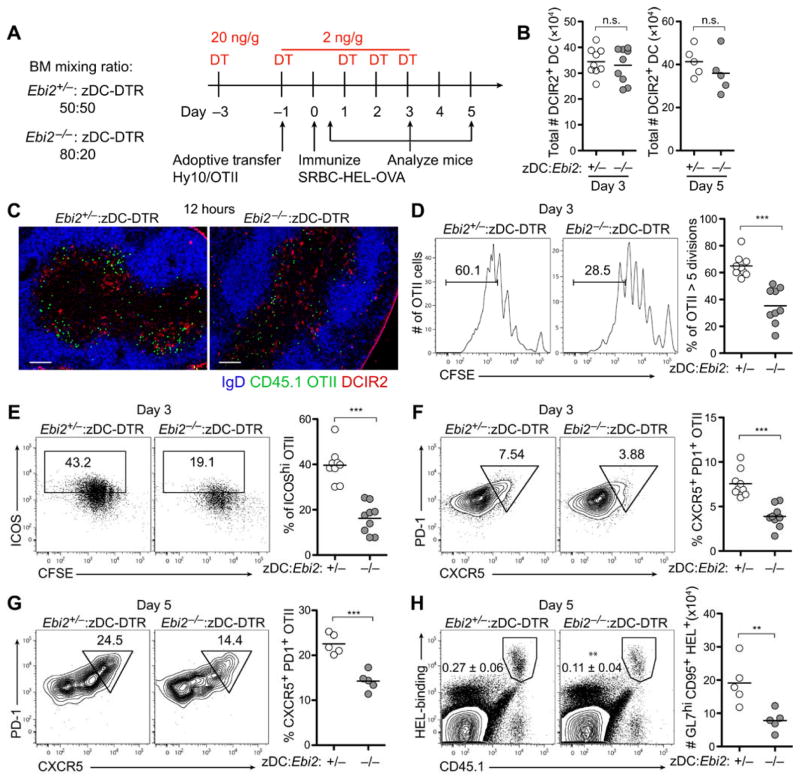
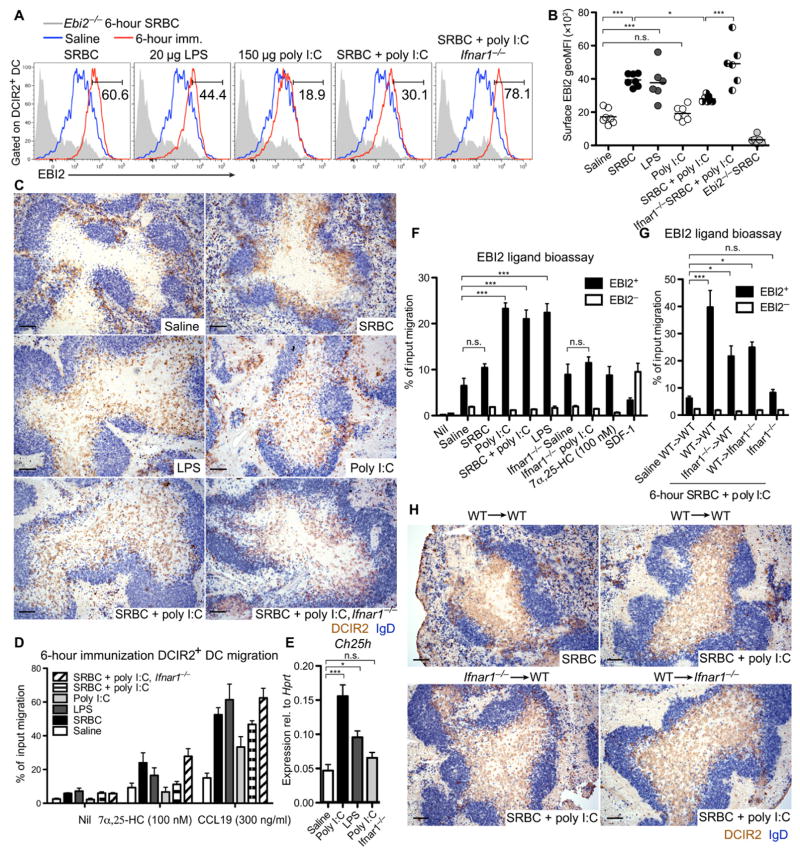
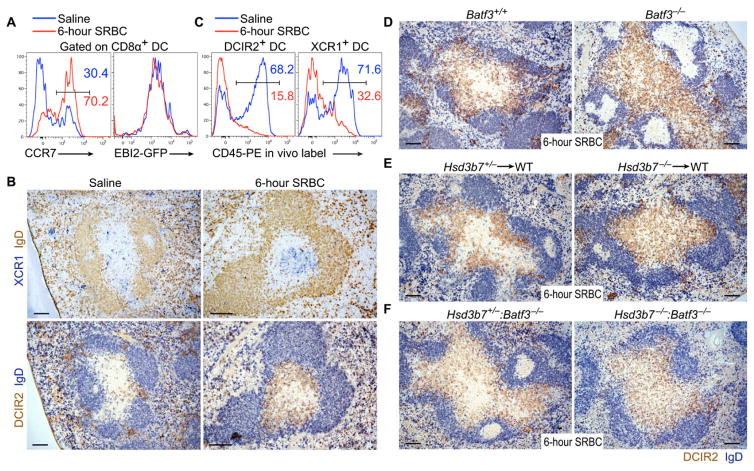
Correct positioning of dendritic cells (DCs) is critical for efficient pathogen encounter and antigen presentation. Epstein-Barr virus-induced gene 2 (EBI2) has been identified as a chemoattractant receptor required for naïve CD4+DCIR2+ DC positioning in response to 7α,25-hydroxycholesterol (7α,25-HC). We now provide evidence that a second EBI2 ligand, 7α,27-HC, is involved in splenic DCIR2+ DC positioning and homeostasis. Cyp27a1, the enzyme uniquely required for 7α,27-HC synthesis, is expressed by stromal cells in the region of naïve DC localization. After activation, DCIR2+ DCs move into the T cell zone. We find that EBI2 is rapidly up-regulated in DCIR2+ DCs under certain activation conditions, and positioning at the B-T zone interface depends on EBI2. Under conditions of type I interferon induction, EBI2 ligand levels are elevated, causing activated DCIR2+ DCs to disperse throughout the T zone. Last, we provide evidence that oxysterol metabolism by Batf3-dependent DCs is important for EBI2-dependent positioning of activated DCIR2+ DCs. This work indicates that 7α,27-HC functions as a guidance cue in vivo and reveals a multitiered role for EBI2 in DC positioning. Deficiency in this organizing system results in defective CD4+ T cell responses.


Figures

Figure 1
Figure 1. Influences of Ch25h and Cyp27a1 on splenic DCIR2+ DCs
(A) Pathway of 7α,25-HC and 7α,27-HC biosynthesis from cholesterol and metabolism by Hsd3b7. (B) Positioning of DCIR2+ DCs (brown) and B cells [immunoglobulin D (IgD), blue] in spleen sections from mice of the indicated genotype. Control indicates Ch25h+/−. Arrowheads indicate the location of MZ bridging channels. F, follicle; T, T cell zone. (C) Summary data for DCIR2+DC frequencies and numbers in mice of the indicated genotypes. Control indicates pooled data from Ch25h+/− and Cyp27a1+/− mice. (D) EBI2 ligand bioassay of spleen extracts from the indicated animals using a reporter cell line (M12) transduced with EBI2. Control indicates Ch25h+/− and Cyp27a1+/−mice. SDF-1, stromal cell-derived factor–1. Nil indicates migration media alone. (E) Cyp27a1 mRNA expression in tissue and cell subsets shown relative to Hprt. LN refers to mesenteric LN. (F) Migration of DCIR2+ DCs toward the indicated oxysterols in Transwell assays. Conc., concentration. Data in (B) to (E) are representative of at least two independent experiments with at least three mice per condition. Migration assay (F) contains data from three independent experiments. Scale bars, 100 μm. *P < 0.05; **P < 0.01; ***P < 0.001; n.s., not significant (P > 0.05) by one-way ANOVA with Bonferroni’s post hoc test for indicated comparisons.
Figure 2
Figure 2. Cyp27a1 Ch25h DKO mice reveal a role for 7α,27-HC in DCIR2+ DC positioning and maintenance
Adult mice were fed 0.5% cholic acid diet for at least 2 weeks. (A to C) Flow cytometry plot (A), summary DCIR2+ DC frequency data (B), and positioning of DCIR2+ DCs (brown) and B cells (IgD, blue) in spleen sections (C) from the indicated mice. (D) EBI2 ligand bioassay of spleen extracts from the indicated mice. (E) LC-MS/MS detection of 7α,27-HC in spleen extracts pooled from 10 to 12 mice for WT and Cyp27a1−/− or from single Hsd3b7−/− mice per measurement. Left: Representative chromatogram (N.D., not detected; n = 2 sets of pooled mice for Cyp27a1−/−). cps, counts per second. (F) Percent change in Ebi2/ DCIR2+ DCs in mice reconstituted with an equal mixture of WT and Ebi2/ BM, calculated by comparing the chimerism of DCIR2+ DCs against CD8α+ DCs. Data in (A) to (D) and (F) are representative of at least two independent experiments with at least three mice per group. Scale bars, 100 μm. *P < 0.05; **P < 0.01; ***P < 0.001; n.s., not significant (P > 0.05) by one-way ANOVA with Bonferroni’s post hoc test for indicated comparisons.
Figure 3
Figure 3. Expression pattern of Cyp27a1, Ch25h, Cyp7b1, and Hsd3b7 transcripts in the spleen determined using RNAscope
(A) Distribution of Cyp27a1, Ch25h, Cyp7b1, and Hsd3b7 mRNA (red) in spleen sections co-stained for IgD (brown). Dashed box indicates staining within MZ bridging channel areas, and arrowheads highlight Ch25h signal at the B-T zone interface. T, T cell zone; F, follicle; R, red pulp. (B) Distribution of Cyp27a1 mRNA in spleen sections of zDC-DTR chimeric mice treated with either saline (top) or DT (bottom). Images are representative of at least five (A) or three (B) mice per condition. Scale bars, 100 μm.
Figure 4
Figure 4. Activated DCIR2+ DCs up-regulate EBI2 and position at the B-T zone interface in an EBI2- and Ch25h-dependent manner
(A and B) Surface expression of EBI2, CCR7, and CD86 in DCIR2+ DCs (A) and GFP expression in Ebi2gfp/+ DCIR2+ DCs (B) from mice 6 hours after intravenous immunization with saline (blue) or SRBCs (red). geoMFI, geometric mean fluorescence intensity. (C) Positioning of DCIR2+ DCs (brown) relative to B cells (blue) in mice 6 hours after treatment with saline, SRBCs plus vehicle (N-methyl-2-pyrrolidone), or SRBCs plus EBI2 antagonist (NIBR189). (D) Percentage of DCIR2+ DC staining in the outer T cell zone in the spleens of the type in (C). Each point represents a white pulp cord. (E) Positioning of DCIR2+ DCs in mice of the indicated genotypes 6 hours after SRBC immunization. (F and G) Positioning of activated T cells overexpressing EBI2 or a control receptor [truncated nerve growth factor receptor (NGFR)] 24 hours after transfer into WT mice (F) or mice of the indicated genotype (G). Sections were stained to detect transduced T cells (hCD4, blue) and B cells (IgD, brown). Data are representative of at least two independent experiments and at least four mice analyzed per condition. Scale bars, 100 μm. ***P < 0.001 by unpaired Student’s t test.
Figure 5
Figure 5. EBI2-mediated DCIR2+ DC positioning in the outer T cell zone augments induction of Tfh cells
(A) Time line of DT treatment, cell transfer, immunization, and analysis. OVA-specific OTII T cells were transferred alone (C to F) or together with HEL-specific Hy10 B cells (G and H) into mice containing matched frequencies of control (Ebi2+/−) or Ebi2−/− DCIR2+ DCs (B) Total DCIR2+ DC numbers in mice 3 or 5 days after immunization. (C) Immunofluorescence images of spleen sections showing distribution of CD45.1+ OTII T cells (green), DCIR2+ DCs (red), and B cells (IgD, blue) 12 hours after immunization. (D) Proliferation of OTII cells 3 days after immunization determined by CFSE dilution. (E and F) Up-regulation of ICOS (E) and acquisition of PD-1 and CXCR5 (F) by OTII cells 3 days after immunization. (G) Acquisition of PD-1 and CXCR5 by OTII cells after cotransfer with Hy10 B cells 5 days after immunization. (H) Frequency of total HEL-binding Hy10 cells (left plots) and total number of GL7hiFas+ HEL-binding B cells (graph on right) from the mice in (G). Images in (C) are representative of three mice, and data in (B), (D), (E), and (F) are representative of two independent experiments with at least three mice per group. Data in (G) and (H) are obtained from one experiment with five mice per condition. Scale bars, 100 μm. **P < 0.01; ***P < 0.001; n.s., not significant (P > 0.05) by unpaired Student’s t test.
Figure 6
Figure 6. Type I IFN suppresses EBI2 up-regulation and disrupts outer T cell zone positioning of DCIR2+ DCs
(A) Surface EBI2 levels on DCIR2+ DCs in WT or Ifnar1−/− mice 6 hours after treatment with the indicated stimuli (red), plotted alongside the same saline-treated (blue) or Ebi2−/− (gray) control. Numbers indicate gate for the immunized (imm.) condition. (B) Summary MFI data from data of the type in (A). (C) Distribution of DCIR2+ DCs (brown) relative to B cells (blue) in the spleen of WT or Ifnar1−/− mice at 6 hours after immunization with the indicated stimuli. (D) Transwell migration of DCIR2+ DCs from WT or Ifnar1−/−mice 6 hours after treatment with the indicated stimuli toward 7α,25-HC or CCL19. (E) Relative expression of Ch25h in total spleen tissue 6 hours after the indicated immunization. (F and G) EBI2 ligand bioassay of spleen extracts from WT and Ifnar1−/− mice (F) or from WT→WT, Ifnar1−/−→WT, WT→Ifnar1−/− chimeric mice, and Ifnar1−/− nonchimeric mice (G) immunized as indicated. (H) Distribution of DCIR2+ DCs (brown) in the spleens of mice in (G) 6 hours after immunization with the indicated stimuli. Data are representative of at least three mice per condition, and migration assay (D) contains data from two independent experiments. Scale bars, 100 μm. *P < 0.05; ***P < 0.001; n.s., not significant (P > 0.05) by one-way ANOVA with Bonferroni’s post hoc test for indicated comparisons.
Figure 7
Figure 7. Hsd3b7-expressing Batf3-dependent DCs are required for outer T cell zone positioning of activated DCIR2+ DCs
(A) CCR7 and EBI2-GFP expression in CD8α+ DCs 6 hours after intravenous immunization with saline or SRBCs. (B) Serial spleen sections from saline or 6-hour SRBC-treated mice stained for XCR1 (upper, blue) or DCIR2 (lower, brown) and IgD (upper, brown; lower, blue). (C) In vivo PE labeling on DCIR2+(left) or XCR1+ (right) DCs in either saline-treated (blue line) or SRBC-treated (red line) mice injected with 1 μg of anti–CD45-PE for 5 min. (D to F) Positioning of DCIR2+ DCs in Batf3−/− and control mice (D), in mice lacking Hsd3b7 in BM-derived cells versus controls (E), or in Batf3−/−:Hsd3b7−/−mixed BM chimeric mice lacking Hsd3b7 in Batf3-dependent DCs versus controls (Batf3−/−:Hsd3b7+/− mixed BM chimeras) (F). Histograms and images are representative of at least three mice analyzed per condition. Scale bars, 100 μm.

References

    1. Durai V, Murphy KM. Functions of Murine Dendritic Cells. Immunity. 2016;45:719–736. - PMC - PubMed
    1. Steinman RM, Pack M, Inaba K. Dendritic cells in the T-cell areas of lymphoid organs. Immunol Rev. 1997;156:25–37. - PubMed
    1. Yi T, Cyster JG. EBI2-mediated bridging channel positioning supports splenic dendritic cell homeostasis and particulate antigen capture. Elife. 2013;2:e00757. - PMC - PubMed
    1. Gatto D, Wood K, Caminschi I, Murphy-Durland D, Schofield P, Christ D, Karupiah G, Brink R. The chemotactic receptor EBI2 regulates the homeostasis, localization and immunological function of splenic dendritic cells. Nat Immunol. 2013 - PubMed
    1. Dorner BG, Dorner MB, Zhou X, Opitz C, Mora A, Guttler S, Hutloff A, Mages HW, Ranke K, Schaefer M, Jack RS, Henn V, Kroczek RA. Selective expression of the chemokine receptor XCR1 on cross-presenting dendritic cells determines cooperation with CD8+ T cells. Immunity. 2009;31:823–833. - PubMed