. 2017 Aug 24;548(7668):461-465.
doi: 10.1038/nature23449. Epub 2017 Jul 24.

cGAS surveillance of micronuclei links genome instability to innate immunity

Affiliations

cGAS surveillance of micronuclei links genome instability to innate immunity

Karen J Mackenzie et al. Nature. .

Abstract

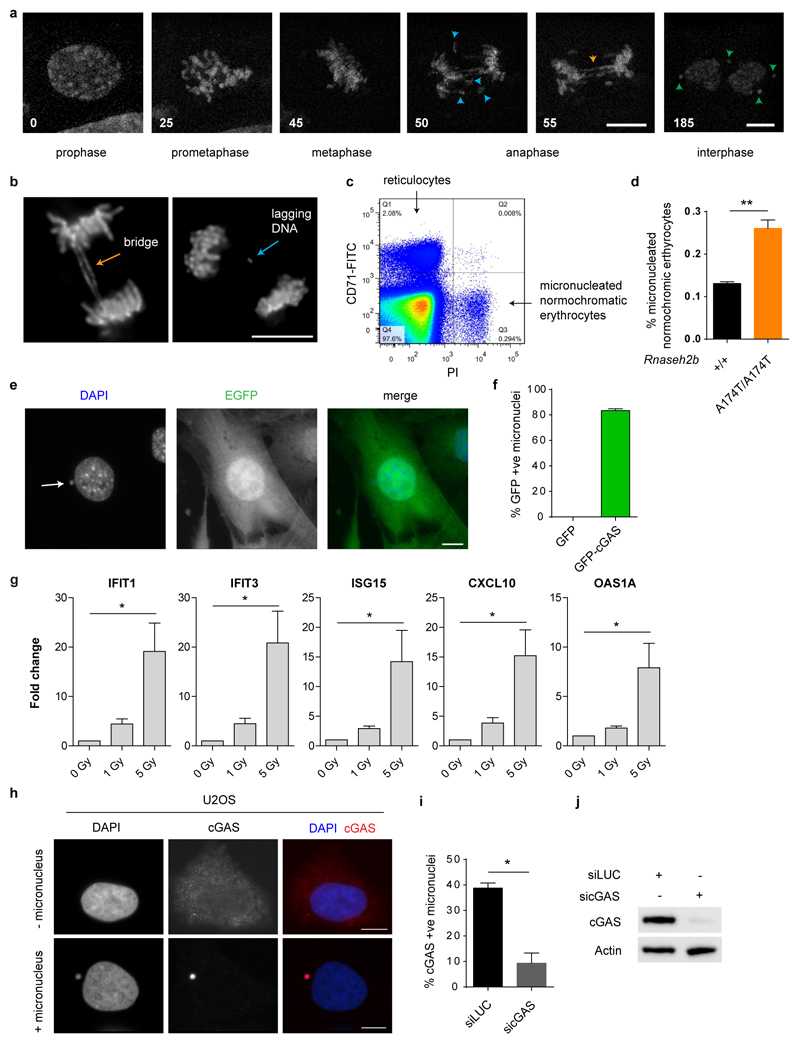
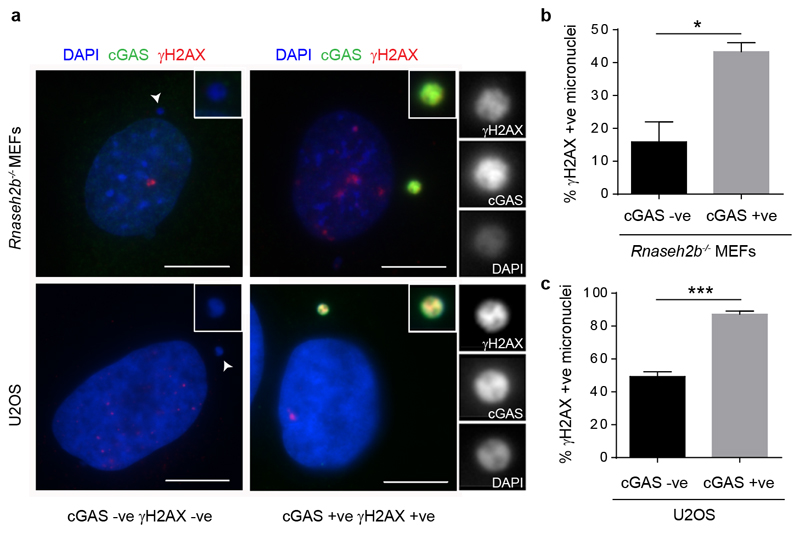
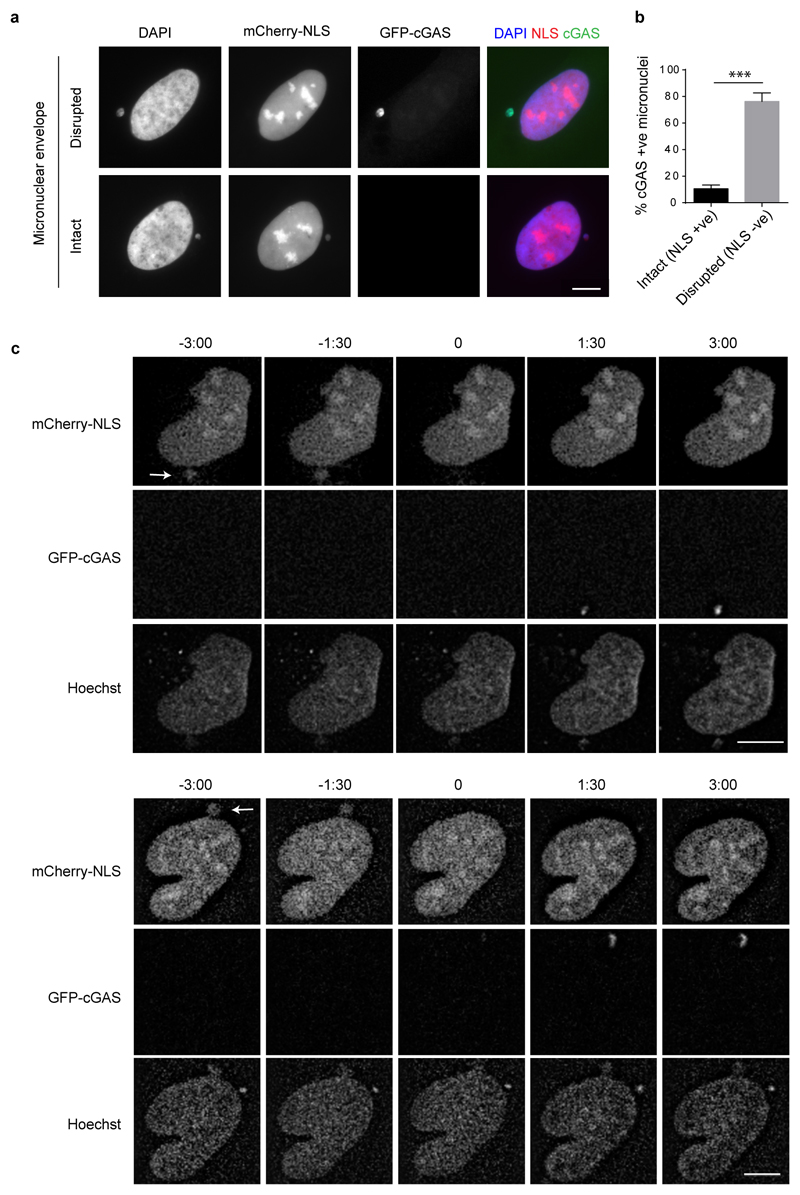
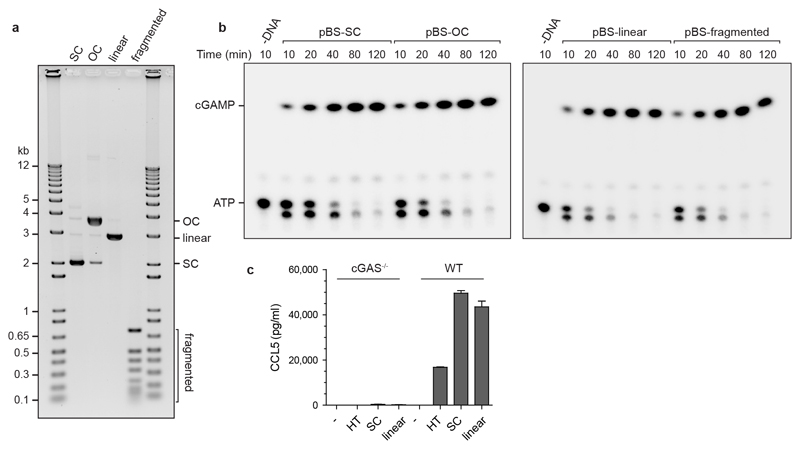
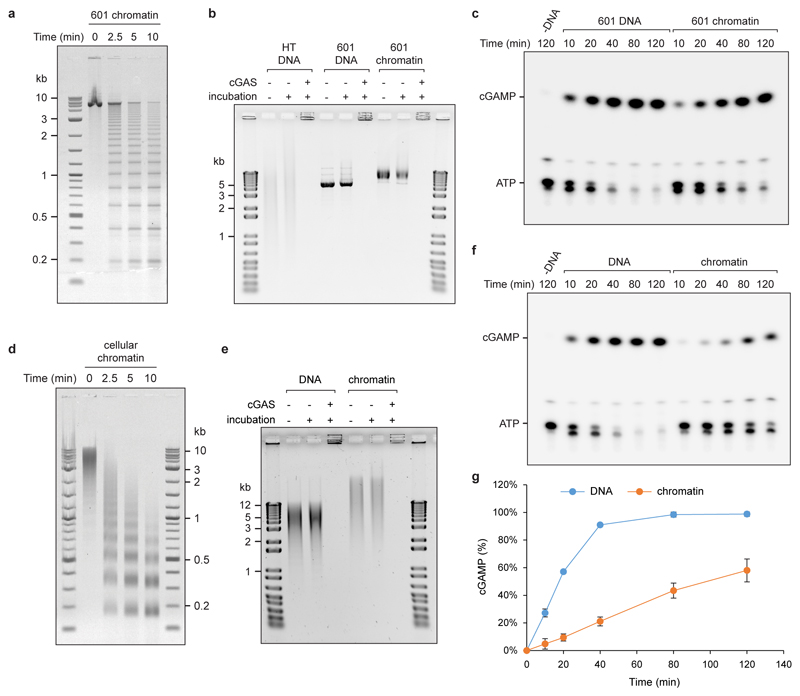
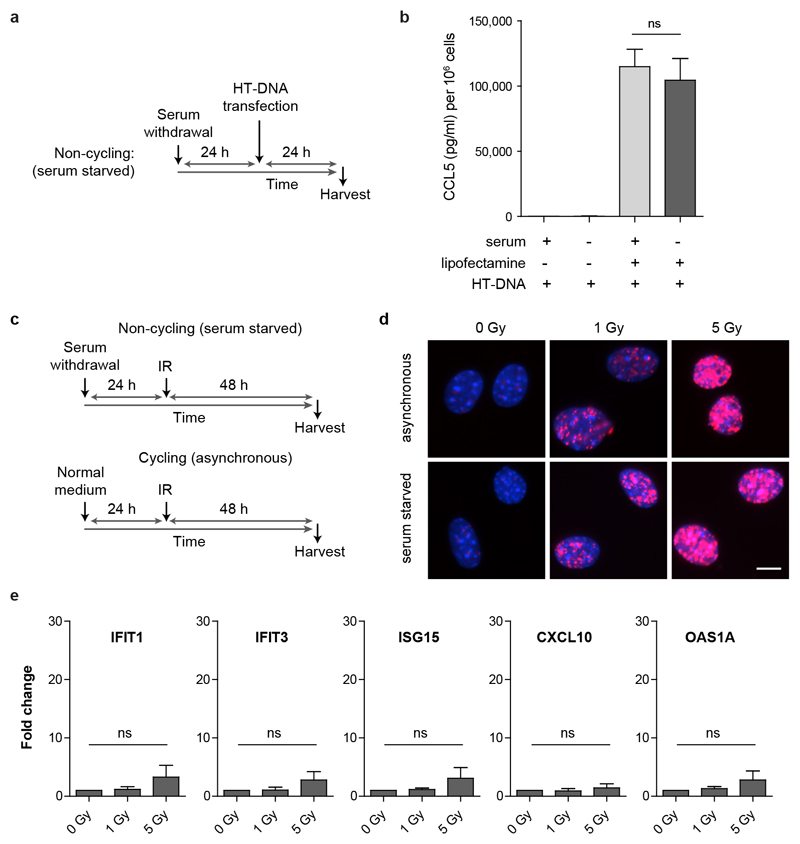
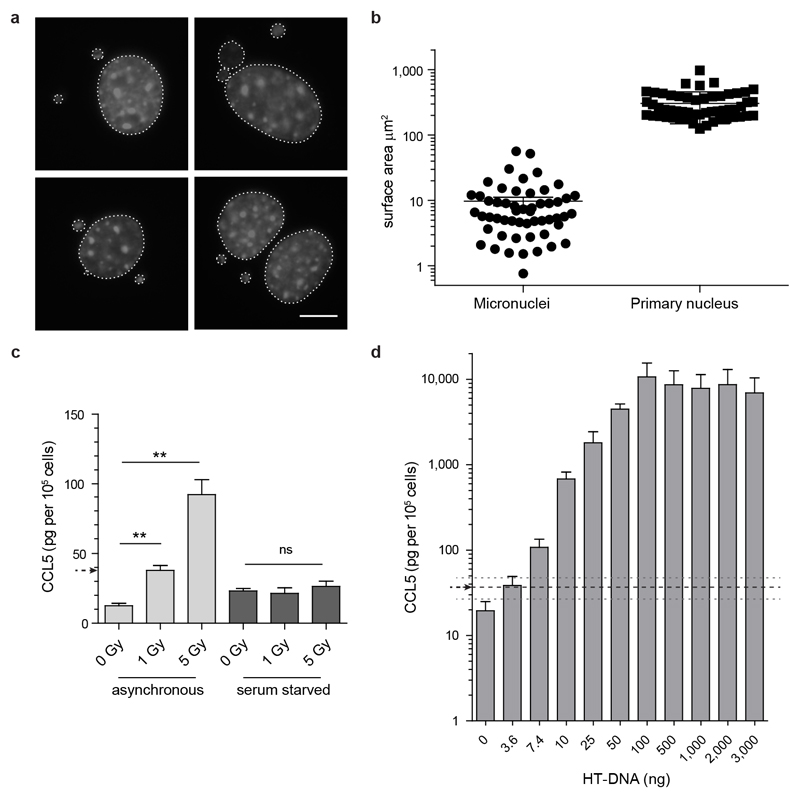
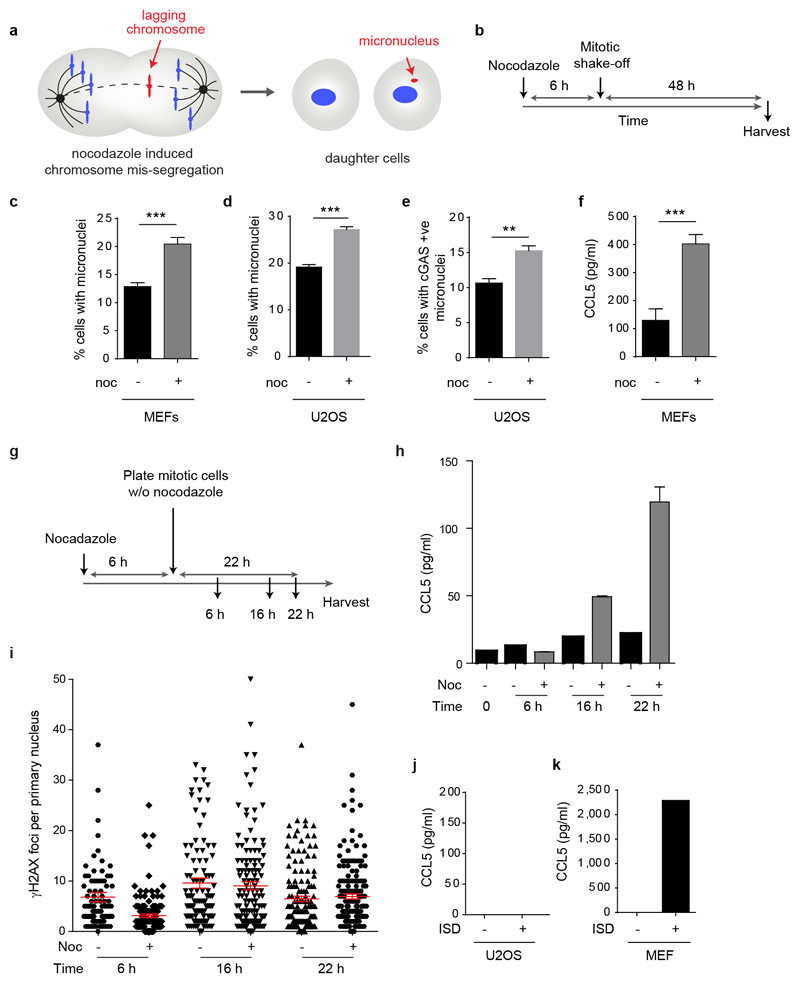
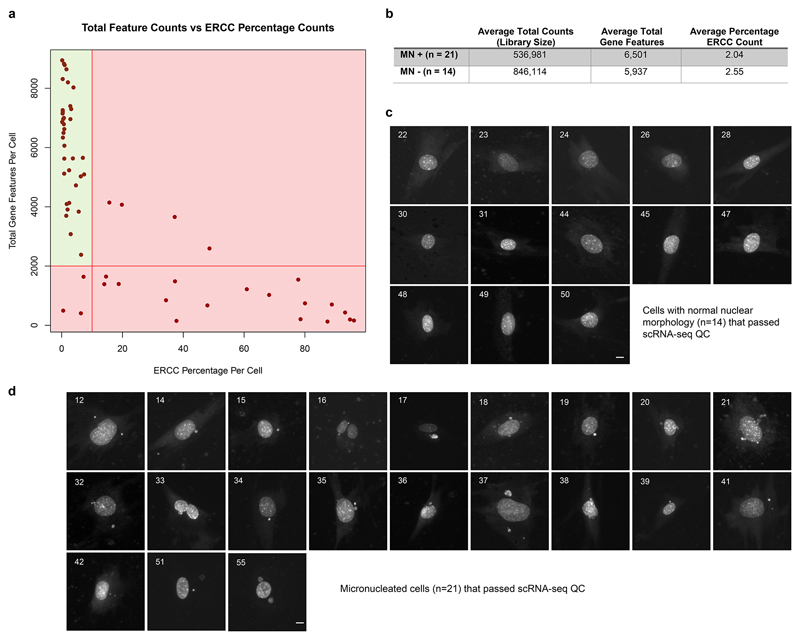
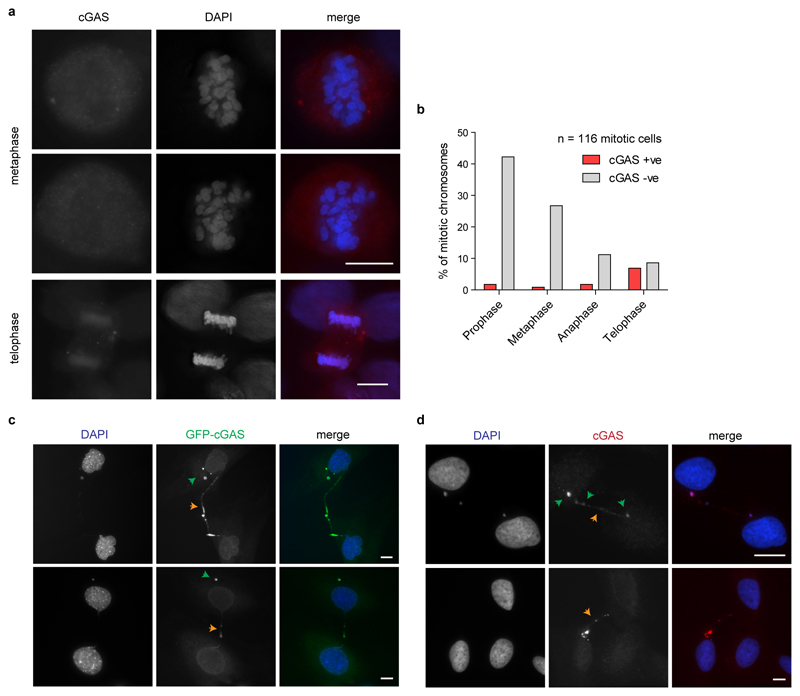
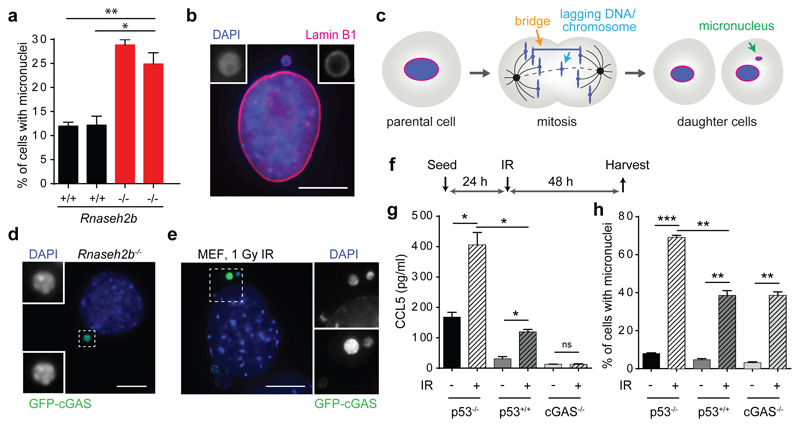
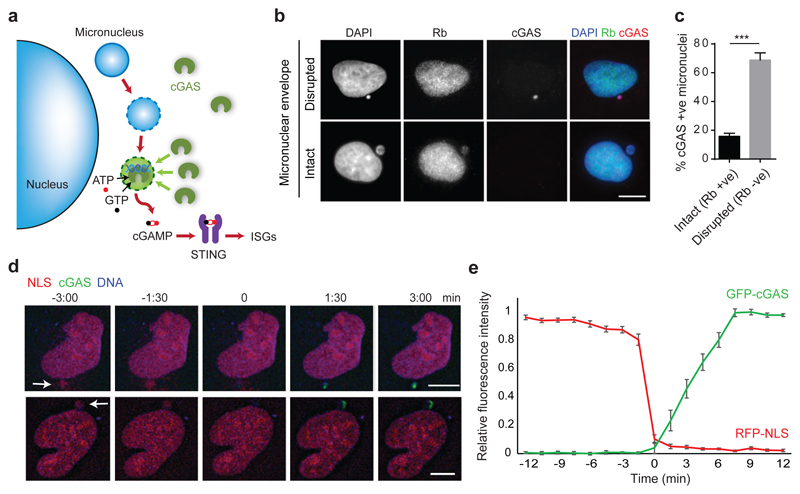
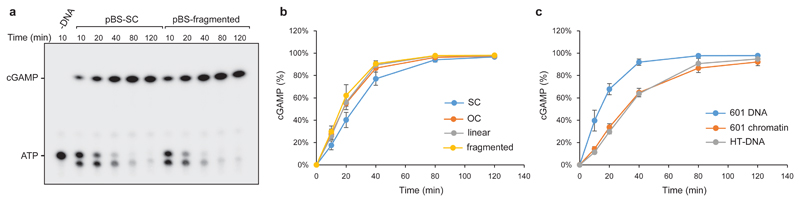
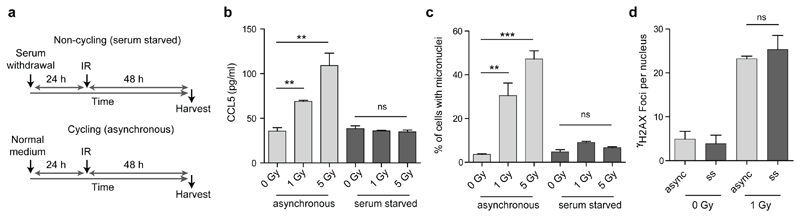
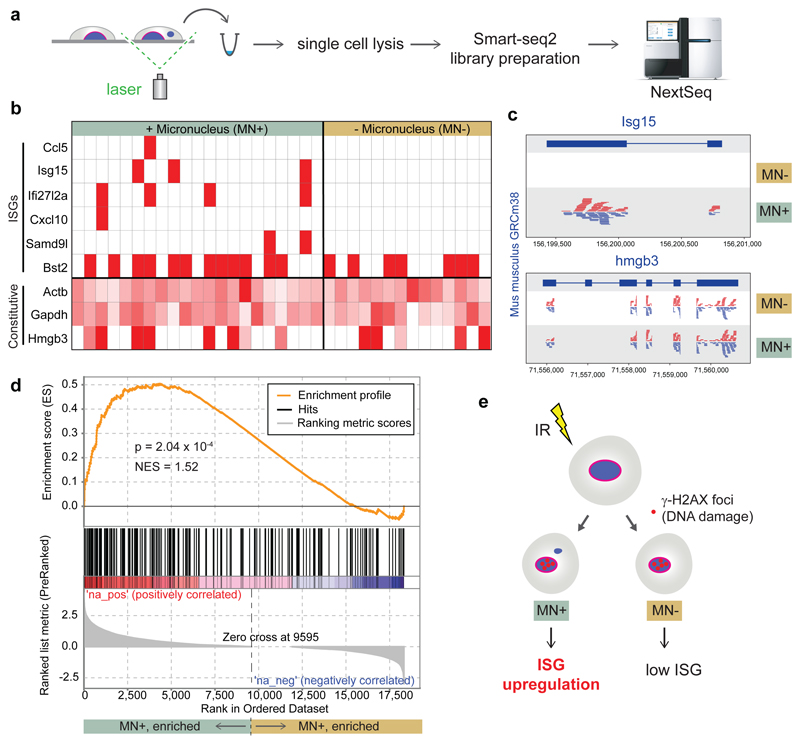
DNA is strictly compartmentalized within the nucleus to prevent autoimmunity; despite this, cyclic GMP-AMP synthase (cGAS), a cytosolic sensor of double-stranded DNA, is activated in autoinflammatory disorders and by DNA damage. Precisely how cellular DNA gains access to the cytoplasm remains to be determined. Here, we report that cGAS localizes to micronuclei arising from genome instability in a mouse model of monogenic autoinflammation, after exogenous DNA damage and spontaneously in human cancer cells. Such micronuclei occur after mis-segregation of DNA during cell division and consist of chromatin surrounded by its own nuclear membrane. Breakdown of the micronuclear envelope, a process associated with chromothripsis, leads to rapid accumulation of cGAS, providing a mechanism by which self-DNA becomes exposed to the cytosol. cGAS is activated by chromatin, and consistent with a mitotic origin, micronuclei formation and the proinflammatory response following DNA damage are cell-cycle dependent. By combining live-cell laser microdissection with single cell transcriptomics, we establish that interferon-stimulated gene expression is induced in micronucleated cells. We therefore conclude that micronuclei represent an important source of immunostimulatory DNA. As micronuclei formed from lagging chromosomes also activate this pathway, recognition of micronuclei by cGAS may act as a cell-intrinsic immune surveillance mechanism that detects a range of neoplasia-inducing processes.


Conflict of interest statement

The authors declare no competing financial interests.

Figures

Extended data Fig 1
Extended data Fig 1. Micronuclei form in RNase H2 deficiency, with cGAS localising to these structures and inducing an ISG response
(a) Still images of live imaging in Rnaseh2b-/- MEFs, time in minutes; t=0, prophase. Lagging DNA (blue arrowheads) and DNA bridges (orange) at anaphase can result in interphase micronuclei (green). (b) Chromatin bridges and lagging chromosomal DNA (indicated by arrows) occur in Rnaseh2b-/- MEFs. Representative fixed cell images. (c, d) Erythrocyte micronuclei assay (c) Representative FACS plot with quadrants containing reticulocytes and micronucleated normochromatic erythrocytes indicated. (d) Rnaseh2bA174T/A174T mice have a significantly increased frequency of micronucleated erythrocytes. Mean ± SEM, n=3 mice per group; two-tailed t-test, ** = P<0.01. (e, f) EGFP does not accumulate in micronuclei, whereas the majority of micronuclei show strong accumulation of GFP-cGAS. (e) Representative image of micronucleus containing Rnaseh2b-/- MEF stably expressing EGFP. (f) Quantification of GFP positive micronuclei for GFP-cGAS and GFP expressing Rnaseh2b-/- MEF lines. Mean ± SEM, n=4 experiments (≥500 cells counted per experiment). Scale bars, 10 µm. (g) Increased levels of ISG transcripts, IFIT1, IFIT3, ISG15, CXCL10 and OAS1A, were detected in C57Bl/6 (p53+/+) MEFs 48 h after IR (1 Gy). Transcript levels were normalised to HPRT. Mean ± SEM, n=3 independent experiments. One-way ANOVA, 2 degrees of freedom, * = P<0.05 (h) Endogenous cytosolic cGAS accumulates in micronuclei in U2OS cells. Representative images of cGAS distribution in cells with or without micronuclei. Images taken using different exposure times (200 vs 700 ms) to visualise weaker cytosolic cGAS signal. (i, j) Verification of anti-cGAS antibody specificity in human cells. (i) The percentage of cGAS positive micronuclei, using anti-cGAS immunofluorescence, was determined microscopically after cGAS or luciferase siRNA knockdown. Mean ± SEM, n=2 experiments (500 cells counted per experiment); two-tailed t-test. While several commercial cGAS antibodies were assessed, specific detection of mouse cGAS by immunofluorescence was not possible with these reagents (data not shown). (j) Immunoblot after siRNA knockdown of cGAS in U2OS cells. siRNA targeting luciferase (siLUC) was used as a negative control. Probing with anti-actin antibody shows equal loading.
Extended data Fig 2
Extended data Fig 2. cGAS localisation is associated with DNA damage in micronuclei
γH2AX foci in micronuclei correlate with GFP-cGAS localisation in Rnaseh2b-/- MEFs and endogenous cGAS localisation in U2OS cells. (a) Representative immunofluorescence images, γH2AX, red; cGAS, green. (b) Percentage of γH2AX stained micronuclei (γH2AX +ve), either co-stained with cGAS (cGAS +ve), or in which cGAS was not detected (cGAS -ve). Rnaseh2b-/- MEFs; ≥500 cells counted per experiment. (c) Quantification for U2OS cells, ≥250 micronuclei counted per experiment. Mean ± SEM, n=3 experiments; * = P<0.05, *** = P<0.001, two-tailed t-test. While our biochemical studies demonstrate that unbroken DNA and chromatin are sufficient to activate cGAS (Fig 3, Extended data Fig 4 and 5), the increased accessibility of DNA after damage could further assist cGAS binding and activation.
Extended data Fig 3
Extended data Fig 3. cGAS localises to micronuclei upon nuclear envelope rupture
(a, b) cGAS localisation to micronuclei in U2OS cells inversely correlates with localisation of mCherry-NLS, the latter present only in micronuclei with an intact nuclear envelope. (a) Representative images of cells containing micronuclei with disrupted or intact nuclear envelope. (b) Percentage of intact and disrupted cGAS positive micronuclei. Mean ± SEM, n=3 independent experiments (≥250 micronuclei counted per experiment). NLS +ve and NLS -ve, mCherry-NLS present in or absent from micronuclei respectively. cGAS +ve, GFP-cGAS present in micronuclei. (c) Single channel image for representative stills shown in Fig 2d from live imaging of U2OS cells expressing mCherry-NLS and GFP-cGAS. DNA visualised with Hoechst. Time (min) relative to loss of mCherry-NLS from micronucleus (t=0, micronuclear membrane rupture). Arrows indicate micronuclei undergoing rupture. Scale bars, 10 µm.
Extended data Fig 4
Extended data Fig 4. cGAS is activated by circular plasmid DNA
(a) Plasmid DNA (SC, supercoiled; OC, open circle; linear and fragmented) separated by agarose gel electrophoresis. pBluescript II SK(+) supercoiled plasmid DNA was treated with Nt.BspQI nicking endonuclease to generate open circle DNA; with EcoRI to generate a single 3 kb linear fragment; or with HpaII to generate 13 fragments between 710 and 26 bp in size. (b) Supercoiled, open circle, linear and fragmented pBluescript (pBS) all activate recombinant cGAS to produce cGAMP. Representative images shown. Quantification of n=3 experiments shown in Fig 3b. (c) Plasmid DNA induces cGAS-dependent CCL5 production in MEFs. Wildtype and cGAS-/- MEFs were transfected with 400 ng of HT-DNA, supercoiled or linearised pBluescript, and CCL5 production after 24 h measured by ELISA. Mean ± SEM, n=3 independent experiments.
Extended data Fig 5
Extended data Fig 5. cGAS is activated by chromatin
(a) Agarose gel of micrococcal nuclease (MNase) digested synthetic chromatin assembled onto a ‘601’ DNA template indicates it has a regular nucleosomal structure. (b) Chromatin and DNA bind recombinant cGAS; DNA in wells could be the result of near charge neutrality of cGAS-DNA complexes or previously reported cGAS oligomerisation. Chromatin is stable under cGAS assay conditions remaining intact during incubation in cGAS reaction buffer, as evidenced by the bandshift compared to naked DNA. (c) Representative TLC image demonstrating cGAMP generation by recombinant cGAS in the presence of chromatin. (d) MNase treatment confirms a nucleosomal ladder pattern for chromatin isolated from mouse NIH3T3 cells. (e) cGAS binds chromatin, and cellular chromatin is stable under cGAS assay conditions. (f, g) Cellular chromatin activates recombinant cGAS, but at a slower rate than the same amount of deproteinised DNA. Representative images shown. Graphs shows quantification from n=3 independent experiments, mean ± SD. Reduced cGAS activation in vitro by chromatin isolated from cells is expected due to 1) the presence of linker histones in addition to the nucleosomal core histones, which has been shown to bind part of the linker DNA, reducing the available sites for cGAS binding, and 2) the use of MNase during the isolation of cellular chromatin. Whereas MNase treatment is needed to fragment the chromatin to allow its purification it will preferentially cleave accessible non-protein-bound portions, which will further reduce the available sites to which cGAS can bind in the final chromatin preparation. However, such nucleosome-free regions are more likely to allow efficient binding and activation of cGAS in vivo.
Extended data Fig 6
Extended data Fig 6. ISG induction by ionizing radiation is abrogated in non-cycling cells
(a) Experimental setup: To arrest cells in G0, serum was withdrawn 24 h before transfection with Herring testis DNA (HT-DNA), and supernatant harvested 24 h later. (b) CCL5 production in response to transfected HT-DNA was equivalent between cycling and serum starved MEFs. Mean ± SEM, n=2 independent experiments. (c) Schematic of experimental protocol. (d) Cycling and G0-arrested cells exhibit the same level of DNA damage as measured by γH2AX foci formation per cell. Representative images; scale bar 10 μm. Quantifications shown in Fig 4d. (e) No significant increase in ISG transcripts, IFIT1, IFIT3, ISG15, CXCL10 and OAS1A, for cells arrested in G0 after serum starvation (experimental setup as in c). Transcript levels were normalised to HPRT. Mean ± SEM. One-way ANOVA, 2 degrees of freedom, n=3 independent experiments; ns = not significant. Compare to Extended data Fig 1g, showing data for matched cycling cells assessed concurrently.
Extended data Fig 7
Extended data Fig 7. Micronuclear DNA is sufficient to account for the radiation-induced cytokine response
(a, b) Measurement of micronuclear DNA content. (a) Representative images. DAPI stained primary nuclei and micronuclei surrounded by dotted lines. Scale bar, 10µm. (b) Quantification of surface area of micronuclei and primary nuclei 48 h after 1 Gy IR. Micronuclear surface area per cell 9.72 ± 1.46 µm2, primary nucleus surface area 303 ± 21 µm2. Horizontal line and error bars: mean ± SEM, n=54 cells. Hence, micronuclear content is ~3.2% of the total MEF genome, post-IR, equating to 190 Mbp of DNA. This corresponds to a total of 8.1 ng of micronuclear DNA in 105 cells post 1 Gy IR (105 diploid murine cells contain a total of 650 ng of genomic DNA, with 39% of cells containing micronuclei, Fig 1h). (c) CCL5 response of wild-type C57/BL6 MEFs to ionizing radiation plotted in pg per 105 cells. Reanalysis of this dataset (first depicted in Fig 4b) confirms that the prior statistical analysis is robust to data normalisation on basis of cell counts at assay endpoint. 1 Gy of irradiation in cycling MEFs results in 38 ± 5 pg (mean ± SD) of CCL5 per 105 cells. (d) Dose response curve of secreted CCL5 in wild-type C57BL/6 (p53+/+) MEFs transfected with serial dilutions of transfected HT-DNA. Therefore around 4 ng of transfected DNA resulted in a similar level of cytokine production to c. Mean, and 95% confidence interval indicated by black and grey dashed lines respectively. Given the similarity of the two estimates, within the same order of magnitude, micronuclear DNA is likely sufficient to account for the immune response observed. Conversely ionizing radiation would not be expected to generate this quantity of small DNA fragments as 1 Gy irradiation generates ~40 double strand breaks (DSBs), and ~1,000 base lesions and single-stranded breaks. DSBs will have an average separation of 150 Mbp, and will therefore be too widely spaced to directly generate small dsDNA fragments. Repair of DNA lesions can generate small single-stranded DNA fragments through endonuclease activity. The best characterised are those generated by nucleotide excision repair where endonucleolytic cleavage yields 24-32 nt ssDNA fragments. As such these are not an ideal substrate for cGAS activation, and 5 million such lesions per cell would have to be generated to produce 4 ng of cytosolic DNA in 105 cells. Hence on the basis of our understanding of the current literature, such DNA fragments are likely to be generated at a level that is orders of magnitude lower than that of micronuclear DNA, after radiation-induced damage.
Extended data Fig 8
Extended data Fig 8. Induction of micronuclei originating from lagging chromosomes leads to a proinflammatory response, but not increased DNA damage in the primary nucleus
(a) Model: micronuclei formation after nocodazole treatment. (b) Schematic of experimental protocol. (c) Percentage of micronucleated cells following nocodazole (noc) treatment of p53-/- MEFs or (d) U2OS cells. Mean ± SEM, n=5 experiments for p53-/- MEFs, n=3 for U2OS cells (e) Percentage of U2OS cells with cGAS positive micronuclei following nocodazole treatment. Mean ± SEM, n=3 experiments. c-e, ≥500 cells counted per experiment. (f) CCL5 secretion following nocodazole treatment of p53-/- MEFs. Mean ± SEM of n=5 experiments. ** = p<0.01, *** = p<0.001, two-tailed t-test; ns = not significant.(g-i) Increased CCL5 production after nocodazole release is observed after 16 h and not associated with increased DNA damage in the primary nucleus. (g) Experimental setup: p53-/- MEFs were arrested with nocodazole for 6 h, mitotic cells harvested by mitotic shake-off and re-plated in fresh media with nocodazole omitted. Supernatants and cells were then collected at indicated time points after growth in medium. (h) Increased CCL5 production was observed from 16 h after release from nocodazole block. Technical duplicate, mean ± SD. Noc (-), asynchronously grown, plated at the same time as mitotic shake-off Noc (+) cells, arrested with nocodazole. (i) No increase in numbers of γH2AX foci in the primary nucleus was observed after release from nocodazole block. n≥100 cells counted per condition. (j, k) CCL5 response to interferon stimulatory DNA (ISD) is absent in (j) U2OS cells but (k) present in MEFs. CCL5 measured by ELISA 8 h after transfection with ISD. n=2 experiments for U2OS cells, n=1 experiment for MEFs.
Extended Data Fig 9
Extended Data Fig 9. scRNA-seq QC and microscopy images of the individual LCM captured cells
(a) Total gene feature counts (reads mapping to a protein coding gene) vs ERCC (RNA spike-in) percentage of total counts per cell. Cells with ERCC percentage counts >10% and/or with feature counts < 2,000 were rejected, indicated by red shaded regions. (b) Summary statistics of 21 micronucleated (MN+) cells and 14 non-micronucleated (MN-) cells that passed QC. (c, d) Microcopy images of cells captured by LCM, that passed QC after scRNA-seq. (c) 14 live cells without micronuclei and (d) 21 live cells with micronuclei were isolated from the same culture dish using laser capture microdissection, and used for single cell mRNA sequencing. DNA was stained with picogreen dsDNA stain. Cells shown are those that passed QC; numbers indicate the order in which cells were captured. Scale bars, 10 μm.
Extended data Fig 10
Extended data Fig 10. cGAS localises to telophase chromosomes and DNA bridges
(a) Endogenous cGAS was stained by immunofluorescence of U2OS cells in mitosis, showing a diffuse staining pattern without accumulation at the DAPI stained condensed chromosomes at metaphase. Two representative images shown. During anaphase/telophase cGAS staining can be seen on DNA in some cells. Overexpressed GFP-cGAS is also observed to localise more widely to mitotic DNA in U2OS cells and MEFs (data not shown). (b) Quantification of cGAS staining during mitosis, by stage. (c) Rnaseh2b-/- p53-/- MEFs stably expressing GFP-cGAS show localisation of cGAS at DNA bridges (orange arrowheads). (d) Endogenous cGAS can also be seen to localise to DNA bridges that occasionally occur in U2OS cells. cGAS also localised to micronuclei that occurred in the same cells (green arrow heads). Interphase chromatin bridges with cGAS bound in Rnaseh2b-/- p53-/- MEFs 0.08% of n=1,223 cells; U2OS cells 0.06% of n=1,632 cells. Scale bars, 10 μm.
Fig 1
Fig 1. cGAS localises to micronuclei resulting from endogenous and exogenous DNA damage
(a) Micronuclei form frequently in Rnaseh2b-/- MEFs, associated with genome instability. Percentage of cells with micronuclei in 2 Rnaseh2b+/+ control and 2 Rnaseh2b-/- MEF lines. Mean ± SEM of n=3 independent experiments (≥500 cells counted per line). (b) Micronuclear DNA is surrounded by its own nuclear envelope. Representative image with Lamin B1 (red) staining the nuclear envelope and DAPI staining DNA (blue). (c) Micronuclei form after mitosis as a consequence of impaired segregation of DNA during mitosis, originating from chromatin bridges and lagging chromosomes/chromatin fragments (further description, Supplementary Text). (d) GFP-cGAS localises to micronuclei in Rnaseh2b-/- MEFs. Representative image of GFP-cGAS expressing Rnaseh2b-/- MEFs. (e-h) cGAS localises to micronuclei induced by ionising radiation, and is associated with a cGAS-dependent proinflammatory response. (e) Representative image of GFP-cGAS positive micronuclei following 1 Gy IR in p53-/- MEFs. (f) p53-/-, p53+/+ and cGAS-/- MEFs were irradiated (1 Gy), and CCL5 production (g) and percentage of cells with micronuclei (h) assessed at 48 h. Mean ± SEM of n=2 independent experiments. * = P<0.05, ** = P<0.01, *** = P<0.001, two-tailed t-test; ns = not significant. Scale bars, 10 µm. Rnaseh2b+/+ and Rnaseh2b-/- MEFs in this figure and subsequent figures, are on a p53-/- C57BL/6J background (absence of p53 is a prerequisite for generation of Rnaseh2b-/- MEFs (20)).
Fig 2
Fig 2. cGAS localises to micronuclei upon nuclear envelope rupture
(a) Model: Micronuclear membrane rupture leads to cGAS sensing of DNA. Micronuclei are susceptible to nuclear envelope collapse, which permits cytosolic cGAS access to genomic dsDNA, initiating a cGAS-STING dependent proinflammatory immune response through production of the second messenger cGAMP. (b, c) cGAS localisation to micronuclei in U2OS cells inversely correlates with localisation of Rb, the latter present only in micronuclei with an intact nuclear envelope. (b) Representative images. (c) Quantification. Mean ± SEM of n=3 independent experiments (≥250 micronuclei counted per experiment); cGAS +ve : cGAS-stained micronuclei; Rb +ve/-ve: micronuclei positive/negative for Rb staining. (d) Representative stills from live imaging of U2OS cells expressing mCherry-NLS and GFP-cGAS. DNA visualised with Hoechst. Time (min) relative to loss of mCherry-NLS from micronucleus (t=0, micronuclear membrane rupture). Arrows indicate micronuclei undergoing rupture. (e) Quantification of cGAS signal accumulating in micronuclei after loss of nuclear envelope integrity. Relative mean fluorescence intensity plotted. Error bars, SEM of n=11 micronuclei.
Fig 3
Fig 3. Continuous and chromatinised DNA activate cGAS
(a, b) Supercoiled and fragmented pBluescript (pBS) both activate recombinant cGAS to produce cGAMP. (a) Representative image of thin layer chromatography (TLC) detection of cGAMP. (b) Quantification of cGAMP measured by TLC over time demonstrates no significant difference in cGAS activation by open circle, linear and fragmented plasmid DNA, with supercoiled DNA showing a minor reduction in cGAMP production. Mean ± SD, n=3 independent experiments. (c) Synthetic chromatin activates cGAS at the same level as herring testis (HT) DNA, but slightly less than the corresponding naked 601 DNA. Quantification of cGAMP measured by TLC. Mean ± SD, n=3 experiments.
Fig 4
Fig 4. Innate immune activation after radiation induced DNA damage is cell cycle dependent
(a) Schematic of experimental protocol. (b) CCL5 production is significantly increased after IR for cycling (asynchronous) cells, but not for cells arrested in G0 after serum starvation. (c) Micronuclei levels are elevated after IR in cycling but not G0-arrested cells. Mean ± SEM, n=3 independent experiments. (d) Cycling and G0-arrested cells exhibit the same level of DNA damage as measured by γH2AX foci formation per cell. Mean ± SD, n=2 independent experiments, ≥100 cells analysed per condition per experiment. (Only 1 Gy quantified, as γH2AX foci overlapped substantially at 5 Gy, see EDF6). ** = P<0.01, *** = P<0.001, two-tailed t-test; ns = not significant.
Fig 5
Fig 5. ISG upregulation occurs specifically in micronucleated cells following DNA damage
(a) Experimental outline: 48 h after irradiation (1 Gy) of C57BL/6J MEFs, individual live cells with normal nuclear morphology (MN-) or with micronuclei (MN+) were identified microscopically and excised by laser microdissection. Single cell transcriptomes were then generated. (b, c) Transcripts of multiple ISGs were detected only in micronucleated cells. (b) Heat map for individual cells, with ISGs and constitutively expressed control genes (Actb, Gapdh, Hmgb3) indicated. Red boxes denote detection of ≥1 read per ISG. Control genes shaded in red according to read count relative to the maximum observed for each gene. (c) Alignment of pooled sequence reads to Isg15 and Hmg3b. (d) Transcriptome-wide analysis (GSEA) demonstrates that a set of 336 ISG genes is significantly enriched (P = 2.04 x 10⁻⁴) in transcriptomes of micronucleated cells. (e) Interpretation of single cell data: After induction of DNA damage by IR, ISG upregulation preferentially occurs in micronucleated cells to those with normal nuclear morphology exposed to identical experimental conditions.

Comment in

References

    1. Roers A, Hiller B, Hornung V. Recognition of Endogenous Nucleic Acids by the Innate Immune System. Immunity. 2016;44:739–754. - PubMed
    1. Ahn J, et al. Inflammation-driven carcinogenesis is mediated through STING. Nature communications. 2014;5:5166. - PMC - PubMed
    1. Gao D, et al. Activation of cyclic GMP-AMP synthase by self-DNA causes autoimmune diseases. Proceedings of the National Academy of Sciences of the United States of America. 2015;112:E5699–5705. - PMC - PubMed
    1. Hartlova A, et al. DNA damage primes the type I interferon system via the cytosolic DNA sensor STING to promote anti-microbial innate immunity. Immunity. 2015;42:332–343. - PubMed
    1. Mackenzie KJ, et al. Ribonuclease H2 mutations induce a cGAS/STING-dependent innate immune response. The EMBO journal. 2016;35:831–844. - PMC - PubMed

Publication types

MeSH terms