

Anthropometric indices for non-pregnant women of childbearing age differ widely among four low-middle income populations
- PMID: 28738791
- PMCID: PMC5525260
- DOI: 10.1186/s12889-017-4509-z
Anthropometric indices for non-pregnant women of childbearing age differ widely among four low-middle income populations
Erratum in
-
Erratum to: BMC Public Health, Vol. 18.BMC Public Health. 2017 Sep 22;17(1):736. doi: 10.1186/s12889-017-4709-6. BMC Public Health. 2017. PMID: 28938882 Free PMC article. No abstract available.
Abstract
Background: Maternal stature and body mass indices (BMI) of non-pregnant women (NPW) of child bearing age are relevant to maternal and offspring health. The objective was to compare anthropometric indices of NPW in four rural communities in low- to low-middle income countries (LMIC).
Methods: Anthropometry and maternal characteristics/household wealth questionnaires were obtained for NPW enrolled in the Women First Preconception Maternal Nutrition Trial. Body mass index (BMI, kg/m2) was calculated. Z-scores were determined using WHO reference data.
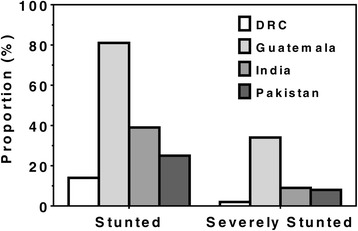
Results: A total of 7268 NPW participated in Equateur, DRC (n = 1741); Chimaltenango, Guatemala (n = 1695); North Karnataka, India (n = 1823); and Thatta, Sindh, Pakistan (n = 2009). Mean age was 23 y and mean parity 1.5. Median (P25-P75) height (cm) ranged from 145.5 (142.2-148.9) in Guatemala to 156.0 (152.0-160.0) in DRC. Median weight (kg) ranged from 44.7 (39.9-50.3) in India to 52.7 (46.9-59.8) in Guatemala. Median BMI ranged from 19.4 (17.6-21.9) in India to 24.9 (22.3-28.0) in Guatemala. Percent stunted (<-2SD height for age z-score) ranged from 13.9% in DRC to 80.5% in Guatemala; % underweight (BMI <18.5) ranged from 1.2% in Guatemala to 37.1% in India; % overweight/obese (OW, BMI ≥25.0) ranged from 5.7% in DRC to 49.3% in Guatemala. For all sites, indicators for higher SES and higher age were associated with BMI. Lower SES women were underweight more frequently and higher SES women were OW more frequently at all sites. Younger women tended to be underweight, while older women tended to be OW.
Conclusions: Anthropometric data for NPW varied widely among low-income rural populations in four countries located on three different continents. Global comparisons of anthropometric measurements across sites using standard reference data serve to highlight major differences among populations of low-income rural NPW and assist in evaluating the rationale for and the design of optimal intervention trials.
Trial registration: ClinicalTrials.gov # NCT01883193 (18 June 2013, retrospectively registered).
Keywords: Body mass index; Democratic Republic of the Congo; Guatemala; Height; India; Low middle income countries; Mid-upper arm circumference; Multi-site; Non-pregnant women; Overweight/obesity; Pakistan; Rural; Stunting; Underweight; Waist-hip ratio; Weight.
Figures


References
Publication types
MeSH terms
Associated data
Grants and funding
LinkOut - more resources
Full Text Sources
Other Literature Sources
Medical
Research Materials
