. 2017 Jul 25;17(1):614.
doi: 10.1186/s12889-017-4528-9.

The risk of HIV transmission at each step of the HIV care continuum among people who inject drugs: a modeling study

Affiliations

The risk of HIV transmission at each step of the HIV care continuum among people who inject drugs: a modeling study

Daniel J Escudero et al. BMC Public Health. .

Abstract

Background: People who inject drugs (PWID) are at continued risk for HIV in the U.S., and experience disparities across the HIV care continuum compared to other high-risk groups. Estimates of the risk of HIV transmission at each stage of the care continuum may assist in identifying public health priorities for averting incident infections among PWID, in addition to transmissions to sexual partners of PWID.

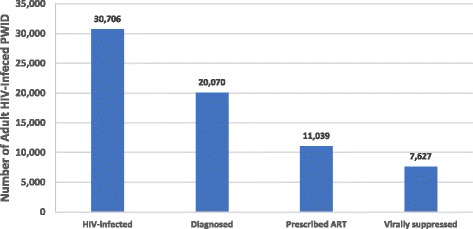
Methods: We created an agent-based model simulating HIV transmission and the HIV care continuum for PWID in New York City (NYC) in 2012. To account for sexual transmission arising from PWID to non-PWID, the simulation included the entire adult NYC population. Using surveillance data and estimates from the National HIV Behavioral Surveillance system, we simulated a dynamic sexual and injecting network. We estimated the proportion of HIV transmission events attributable to PWID in the following categories, those: without an HIV diagnosis ('Undiagnosed'); diagnosed but not on antiretroviral therapy (ART) ('Diagnosed - not on ART'); those who initiated ART but were not virally suppressed ('Unsuppressed'); and, those who achieved viral suppression ('Suppressed').

Results: We estimated HIV incidence among PWID to be 113 per 100,000 person-years in 2012, with an overall incidence rate for the entire adult NYC population of 33 per 100,000 person-years. Despite accounting for only 33% of the HIV-infected PWID population, the Undiagnosed were associated with 52.6% (95% simulation interval [95% SI]: 47.1-57.0%) of total transmission events. The Diagnosed - not on ART population contributed the second-largest proportion of HIV transmissions, with 36.6% (95% SI: 32.2-41.5%). The Unsuppressed population contributed 8.7% (95% SI: 5.6-11.8%), and Suppressed 2.1% (95% SI: 1.1-3.9%), relatively little of overall transmission.

Conclusions: Among PWID in NYC, more than half (53%) of transmissions were from those who were unaware of their infection status and more than 36% were due to PWID who knew their status, but were not on treatment. Our results indicate the importance of early diagnosis and interventions to engage diagnosed PWID on treatment to further suppress population-level HIV transmission. Future HIV prevention research should focus on the elimination of identified and potential barriers to the testing, diagnosis, and retention of PWID on HIV treatment.

Keywords: ART; HAART; HIV care cascade; HIV care continuum; People who inject drugs.


Conflict of interest statement

Ethics approval and consent to participate

Not applicable.

Consent for publication

Not applicable.

Competing interests

The authors declare that they have no competing interests.

Publisher’s Note

Springer Nature remains neutral with regard to jurisdictional claims in published maps and institutional affiliations.

Figures

Fig. 1
Fig. 1
Estimated HIV Care Continuum for People Who Inject Drugs in New York City in 2012. Sources: [20, 23, 25]. Note: The number of HIV-infected people who inject drugs was estimated using data on the proportion of undiagnosed cases among men and women from the NHBS-IDU-3 New York City data, whereas the other values were estimated using surveillance data from the New York City Department of Health and Mental Hygiene. These estimates are only among adults, defined as aged >19 years. Column headings are defined as follows: HIV Infected – total persons with HIV infection; Diagnosed – total persons with diagnosed HIV infection; Prescribed ART – total persons prescribed ART for HIV infection; Virally suppressed – total persons who have achieved HIV viral suppression (viral load <200/mL)
Fig. 2
Fig. 2
Population Size and Transmission Attributable to HIV Care Continuum Steps Among People Who Inject Drugs. Abbreviations: ART: antiretroviral therapy; HIV: human immunodeficiency virus. Note: The green bars (population proportion) correspond to the proportion of HIV-infected people who inject drugs in New York City in 2012 in a given step of the HIV care continuum. The blue bars (transmission proportion) correspond to the proportion of HIV transmission attributable to those in a given step of the HIV care continuum. The HIV care continuum categories are defined as follows: Undiagnosed - those without a positive HIV diagnosis; Diagnosed-not on ART - those positively diagnosed but not enrolled on ART; Unsuppressed - those enrolled on ART but not virally suppressed; Suppressed - those who have achieved viral suppression. The population proportion refers to the average proportion of HV-infected people who inject drugs in the respective care continuum step over the one-year study period. The error bars represent the 95% simulation interval obtained from the 10,000 Monte Carlo runs used to estimate the main results
Fig. 3
Fig. 3
Transmission Attributable to HIV Care Continuum Steps Among People Who Inject Drugs: Sensitivity Analyses. Abbreviations: ART: antiretroviral therapy; HIV: human immunodeficiency virus. Note: The estimates presented here correspond to the proportion of HIV transmission attributable to those in a given step of the HIV care continuum among people who inject drugs in New York City in 2012. Each of the six panels on the horizontal axis present the results of sensitivity analyses wherein a specific assumption model assumption was adjusted from the main analysis. The HIV care continuum categories are defined as follows: Undiagnosed - those without a positive HIV diagnosis; Diagnosed-not on ART - those positively diagnosed but not enrolled on ART; Unsuppressed - those enrolled on ART but not virally suppressed; Suppressed - those who have achieved viral suppression

Similar articles

Cited by

References

    1. Centers for Disease Control and Prevention. HIV Surveillance Report, 2015; vol. 27. http://www.cdc.gov/hiv/library/reports/surveillance/. Accessed 30 May 2017.
    1. Des Jarlais DC, Kerr T, Carrieri P, Feelemyer J, Arasteh K. HIV infection among persons who inject drugs: ending old epidemics and addressing new outbreaks. AIDS. 2016;30(6):815–826. doi: 10.1097/QAD.0000000000001039. - DOI - PMC - PubMed
    1. Peters PJ, Pontones P, Hoover KW, Patel MR, Galang RR, Shields J, et al. HIV infection linked to injection use of Oxymorphone in Indiana, 2014-2015. N Engl J Med. 2016;375(3):229–239. doi: 10.1056/NEJMoa1515195. - DOI - PubMed
    1. Rich JD, Adashi EY. Ideological anachronism involving needle and syringe exchange programs: lessons from the Indiana HIV outbreak. JAMA. 2015;314(1):23–24. doi: 10.1001/jama.2015.6303. - DOI - PMC - PubMed
    1. Cicero TJ, Ellis MS, Surratt HL, Kurtz SP. The changing face of heroin use in the United States: a retrospective analysis of the past 50 years. JAMA Psychiatry. 2014;71(7):821–826. doi: 10.1001/jamapsychiatry.2014.366. - DOI - PubMed