. 2017 Sep 1;199(5):1706-1715.
doi: 10.4049/jimmunol.1700552. Epub 2017 Jul 24.

Zebrafish B Cell Development without a Pre-B Cell Stage, Revealed by CD79 Fluorescence Reporter Transgenes

Affiliations

Zebrafish B Cell Development without a Pre-B Cell Stage, Revealed by CD79 Fluorescence Reporter Transgenes

Xingjun Liu et al. J Immunol. .

Abstract

CD79a and CD79b proteins associate with Ig receptors as integral signaling components of the B cell Ag receptor complex. To study B cell development in zebrafish, we isolated orthologs of these genes and performed in situ hybridization, finding that their expression colocalized with IgH-μ in the kidney, which is the site of B cell development. CD79 transgenic lines were made by linking the promoter and upstream regulatory segments of CD79a and CD79b to enhanced GFP to identify B cells, as demonstrated by PCR analysis of IgH-μ expression in sorted cells. We crossed these CD79-GFP lines to a recombination activating gene (Rag)2:mCherry transgenic line to identify B cell development stages in kidney marrow. Initiation of CD79:GFP expression in Rag2:mCherry+ cells and the timing of Ig H and L chain expression revealed simultaneous expression of both IgH-μ- and IgL-κ-chains, without progressing through the stage of IgH-μ-chain alone. Rag2:mCherry+ cells without CD79:GFP showed the highest Rag1 and Rag2 mRNAs compared with CD79a and CD79b:GFP+ B cells, which showed strongly reduced Rag mRNAs. Thus, B cell development in zebrafish does not go through a Raghi CD79+IgH-μ+ pre-B cell stage, different from mammals. After the generation of CD79:GFP+ B cells, decreased CD79 expression occurred upon differentiation to Ig secretion, as detected by alteration from membrane to secreted IgH-μ exon usage, similar to in mammals. This confirmed a conserved role for CD79 in B cell development and differentiation, without the requirement of a pre-B cell stage in zebrafish.


Figures

FIGURE 1.
FIGURE 1.
Zebrafish CD79a and CD79b protein alignment. (A and B) Alignment of zebrafish CD79a and CD79b amino acid sequences with channel catfish, mouse, and human orthologs. ITAM domains are indicated by bold lines below the sequences; the two key tyrosines are labeled by asterisks.
FIGURE 2.
FIGURE 2.
Predominant expression of CD79a and CD79b in kidney by in situ hybridization. (A) In situ hybridization of IgH-μ, CD79a, and CD79b antisense RNA probes to thin sections of zebrafish kidney. Images were processed with Nuance software to highlight hybridization signal stained by NBT/5-bromo-4-chloro-3-indolyphosphate. Right panels show background with sense probes. Scale bars, 400 μm. (B) RT-PCR analysis of CD79a and CD79b in zebrafish tissues. Image color is inverted for clarity.
FIGURE 3.
FIGURE 3.
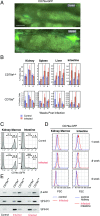
GFP expression in CD79a and CD79b transgenic zebrafish identify B cells. (A) Diagram of production of transgenic constructs, made by long PCR from BACs containing CD79a and CD79b, where the first coding exon of each was replaced by an EGFP-PolyA segment. (B) Low power (left panels) and higher power (right panels) images of GFP expression in thin sections of kidney region of adult (4–6 mo) CD79a-GFP and CD79b-GFP zebrafish. Images were processed with Nuance software to reduce background autofluorescence. Scale bars, 100 μm (left), 200 μm (right). (C) Presence of CD79a:GFP+ and CD79b:GFP+ cells outside head kidney in adult fish. CD79a-GFP, ×4 cryosection. Scale bar, 100 μm (left), and original magnification ×10 image of cryosection. Scale bar, 200 μm (right). CD79a-GFP transgenic zebrafish also showing intestinal region. Scale bar, 200 μm. (D) Flow cytometry histogram plots of kidney marrow tissue from CD79a-GFP and CD79b-GFP lines. (E) GFP and GFP+ cell fractions were purified by electronic cell sorting from Lck-GFP, CD79a-GFP, and CD79b-GFP kidney tissue. Figure shows ethidium bromide staining of DNA amplified by RT-PCR from these samples. The lines indicate where parts of the image were joined.
FIGURE 4.
FIGURE 4.
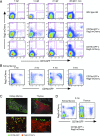
Identification of developing and mature B cells in CD79a-GFP and CD79b-GFP × Rag2-mCherry double-transgenic zebrafish. (A) B cells in young CD79a-GFP and CD79b-GFP zebrafish larvae identified by coexpression with Rag2:mCherry, analyzed by flow cytometry. Wild-type zebrafish AB line is shown as a control. Representative data of four to seven sample analyses from each day postferilization zebrafish are shown. (B) Kidney marrow of 1–8 mo CD79a-GFP × Rag2-mCherry. Dotted region is GFPmCherry. (C) Five month CD79b-GFP × Rag2-mCherry zebrafish. Low-power (top) and high-power (bottom) images of thin sections of kidney and thymus are shown. Scale bars, 200 μm (top) and 100 μm (bottom). (D) Flow cytometry analysis of adult CD79b-GFP × Rag2-mCherry zebrafish kidney and thymus. Dotted region is GFPmCherry. Frequency of CD79b:GFP+ cells in kidney is 26.4%, in thymus is 5%. Data are representative of five separate CD79b/Rag2 transgenic fish kidney analyses.
FIGURE 5.
FIGURE 5.
Characterization of B cell development in kidney marrow of CD79-GFP × Rag2:mCherry zebrafish. (A) RT-PCR detection of both IgH-μ and IgL-κ genes at 3 wk (21 dpf) age for CD79b:GFP+ cells sorted from macerated zebrafish clutches. In adults, CD79b:GFP+ cells were sorted from kidney. (B) Left: 4 mo. CD79b/Rag2 transgenic fish kidney. Two-color flow cytometry plot shows regions of cells sorted for analysis. Right: RT-PCR analysis of kidney fractions for Ig expression. (C) Differences in cell size detected by light scatter. (D) Differences in cell cycle profiles detected by PI staining. (E) Reduction of Rag2-mCherry level from Fr. 1 stage. Gray is mCherryGFP fraction. (F) Three month CD79a/Rag2 transgenic fish kidney. Fractions and RT-PCR analysis. (G) qRT-PCR of fractions from 3 to 4 mo. CD79a and CD79b/Rag2 transgenic lines (n = 4–5 for each fraction, mean ± SE). CD79a/Rag2 and CD79b/Rag2 data were similar, and total data are shown.
FIGURE 6.
FIGURE 6.
Zebrafish B cell response to bacterial infection with CD79 reduction. (A) Low-power images of intestinal region of PBS control and bacteria injected CD79a-GFP fish at 1 wk postinfection. Scale bars, 1 mm. (B) Percentage of CD79a++ and CD79a+ cells in indicated tissues at 1, 2, and 4 wk postinfection; n = 3 each, mean ± SE. (C) Flow cytometry histograms of CD79a++ and CD79a+ cells in kidney and intestine tissue 1 wk postinfection, showing the clear increase in low CD79+ cells in intestine. (D) Increase in size of CD79a+ cells from intestine of infected fish, detected by flow cytometry using forward light scatter (FSC). (E) CD79a+ cells are enriched for secreted IgM compared with CD79a++ cells. RT-PCR analysis of β-actin, membrane IgH-μ (m), and secreted IgH-μ (s).

References

    1. Flajnik M. F., Kasahara M. 2010. Origin and evolution of the adaptive immune system: genetic events and selective pressures. Nat. Rev. Genet. 11: 47–59. - PMC - PubMed
    1. de Jong J. L., Zon L. I. 2005. Use of the zebrafish system to study primitive and definitive hematopoiesis. Annu. Rev. Genet. 39: 481–501. - PubMed
    1. Paik E. J., Zon L. I. 2010. Hematopoietic development in the zebrafish. Int. J. Dev. Biol. 54: 1127–1137. - PubMed
    1. Trede N. S., Langenau D. M., Traver D., Look A. T., Zon L. I. 2004. The use of zebrafish to understand immunity. Immunity 20: 367–379. - PubMed
    1. Langenau D. M., Ferrando A. A., Traver D., Kutok J. L., Hezel J. P., Kanki J. P., Zon L. I., Look A. T., Trede N. S. 2004. In vivo tracking of T cell development, ablation, and engraftment in transgenic zebrafish. Proc. Natl. Acad. Sci. USA 101: 7369–7374. - PMC - PubMed

Publication types

MeSH terms