. 2017 Aug 8;114(32):E6603-E6612.
doi: 10.1073/pnas.1706011114. Epub 2017 Jul 24.

Rho-associated kinase is a therapeutic target in neuroblastoma

Affiliations

Rho-associated kinase is a therapeutic target in neuroblastoma

Cecilia Dyberg et al. Proc Natl Acad Sci U S A. .

Abstract

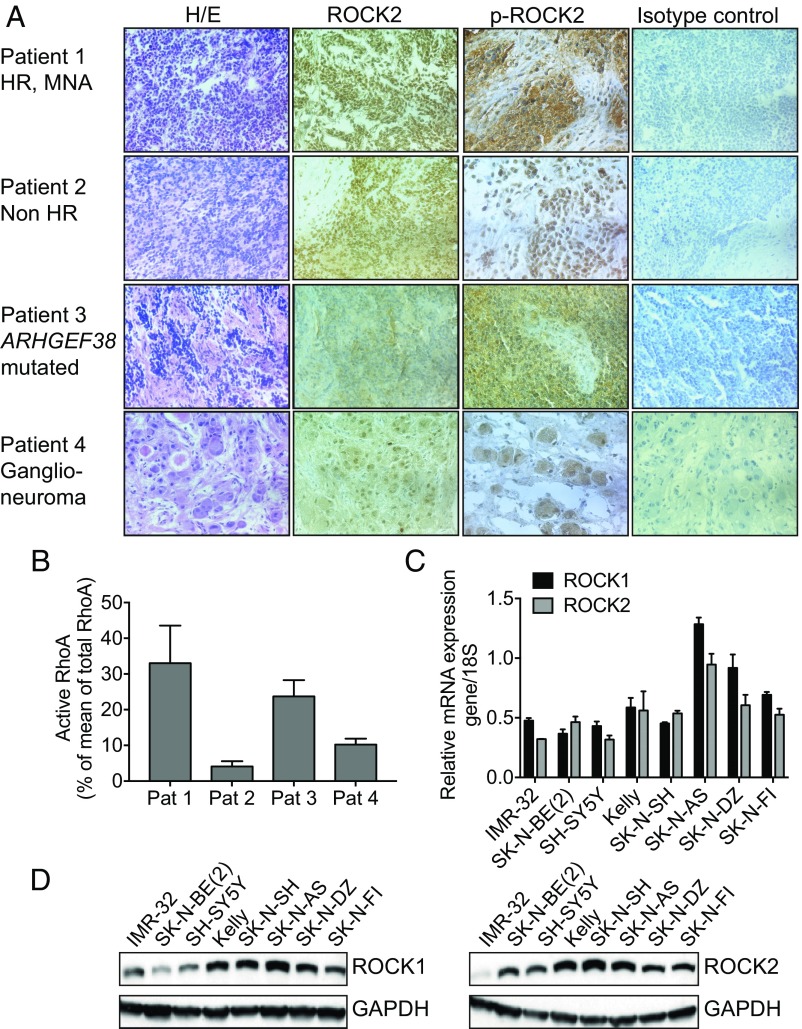
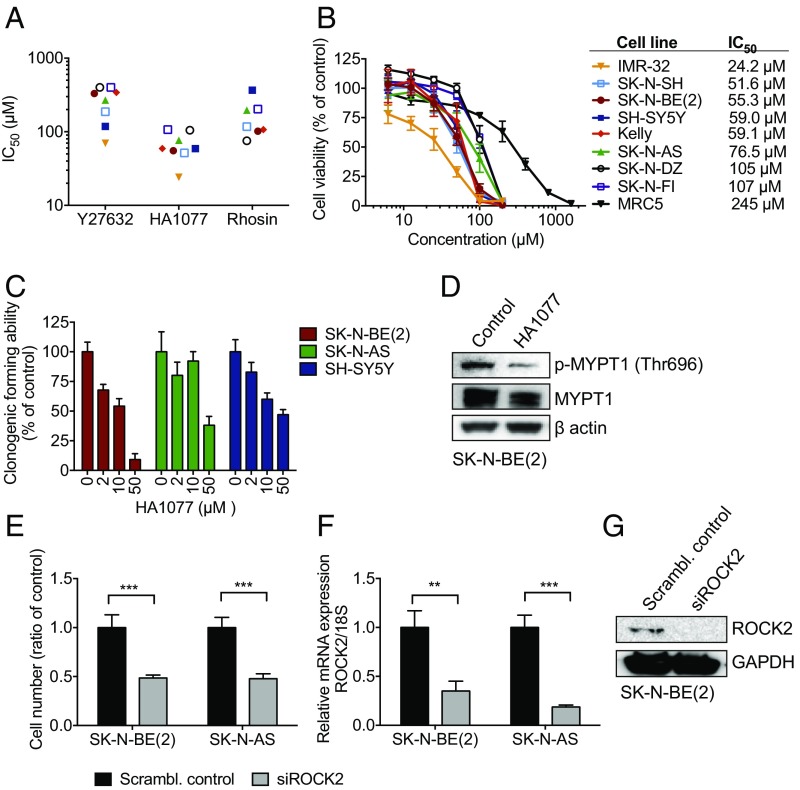
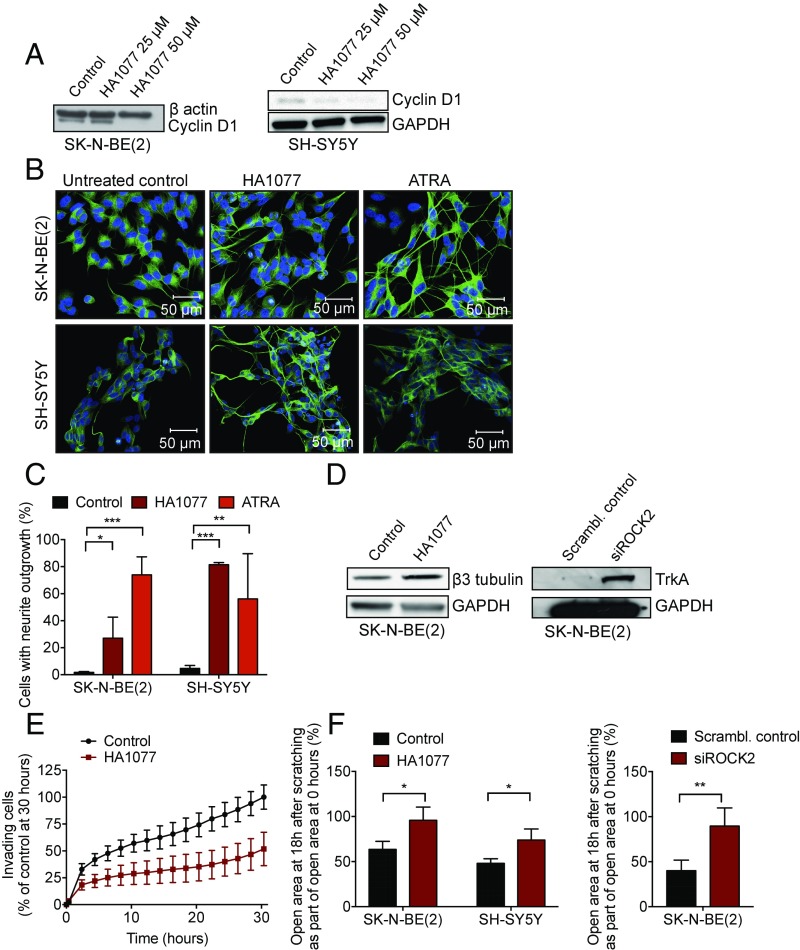
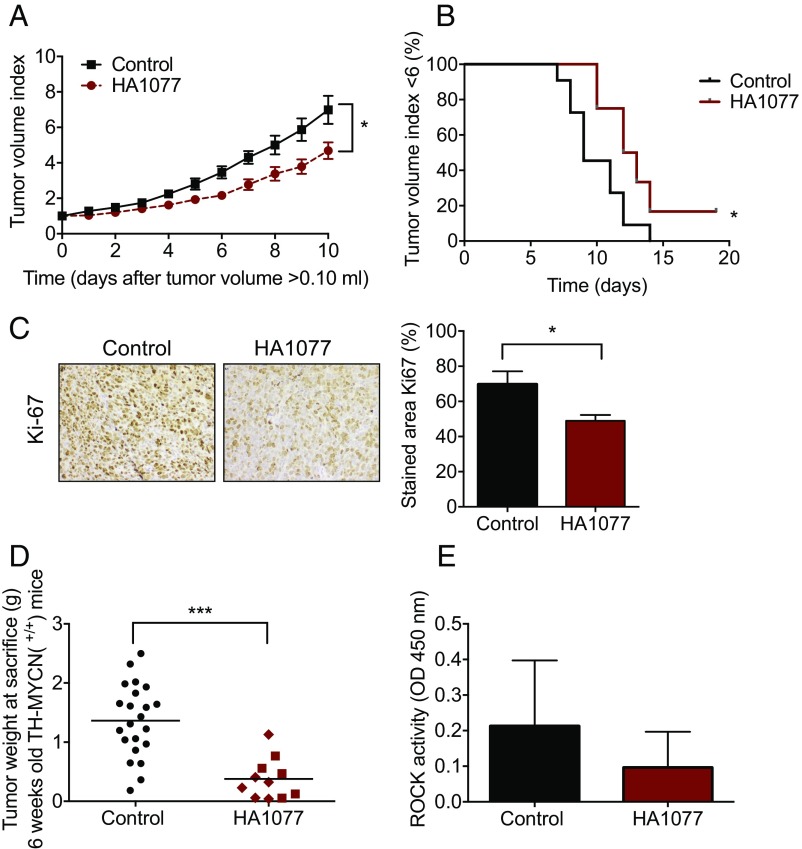
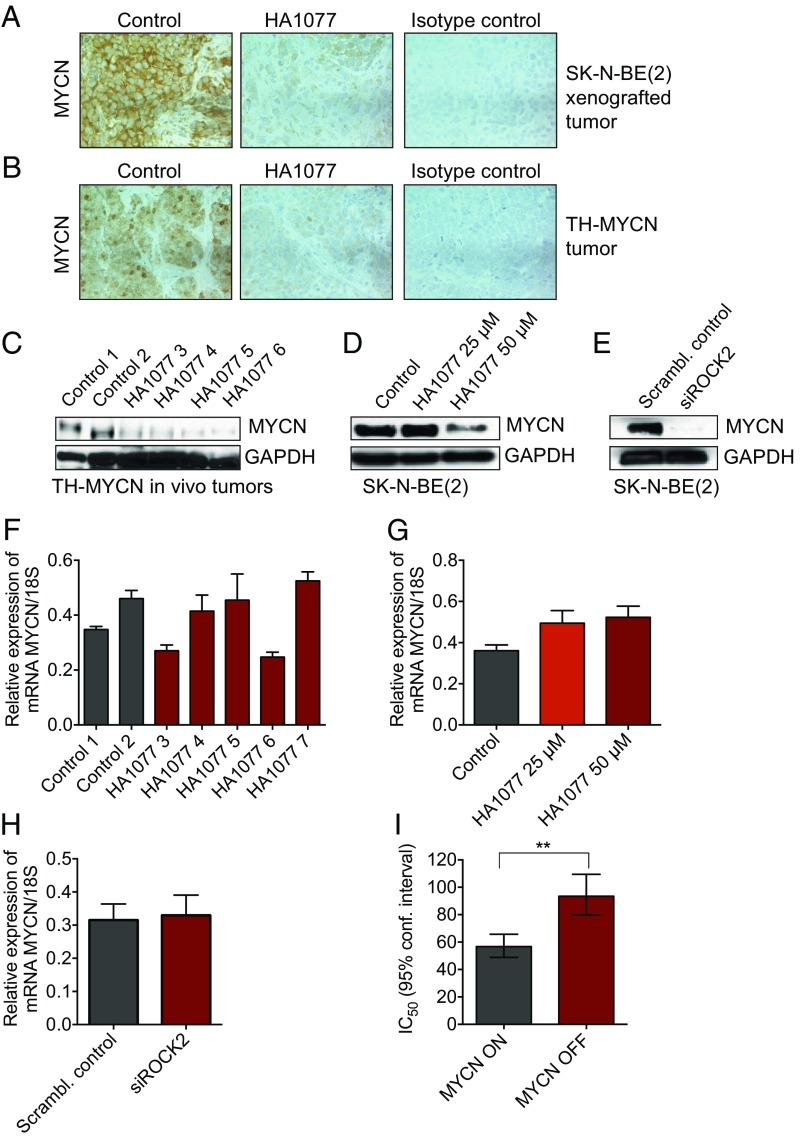
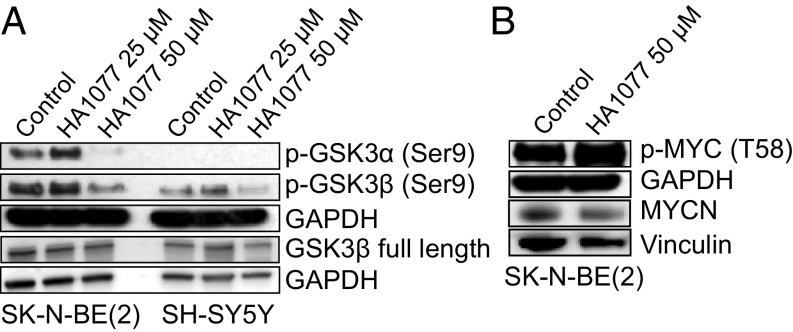
Neuroblastoma is a peripheral neural system tumor that originates from the neural crest and is the most common and deadly tumor of infancy. Here we show that neuroblastoma harbors frequent mutations of genes controlling the Rac/Rho signaling cascade important for proper migration and differentiation of neural crest cells during neuritogenesis. RhoA is activated in tumors from neuroblastoma patients, and elevated expression of Rho-associated kinase (ROCK)2 is associated with poor patient survival. Pharmacological or genetic inhibition of ROCK1 and 2, key molecules in Rho signaling, resulted in neuroblastoma cell differentiation and inhibition of neuroblastoma cell growth, migration, and invasion. Molecularly, ROCK inhibition induced glycogen synthase kinase 3β-dependent phosphorylation and degradation of MYCN protein. Small-molecule inhibition of ROCK suppressed MYCN-driven neuroblastoma growth in TH-MYCN homozygous transgenic mice and MYCN gene-amplified neuroblastoma xenograft growth in nude mice. Interference with Rho/Rac signaling might offer therapeutic perspectives for high-risk neuroblastoma.

Keywords: ROCK; Rho signaling; Wnt signaling; neuroblastoma; personalized medicine.


Conflict of interest statement

The authors declare no conflict of interest.

Figures

Fig. 1.
Fig. 1.
ROCK2 is expressed in human neuroblastoma tumor samples and cell lines. (A) ROCK2 and phosphorylated ROCK2 (p-ROCK2) in tumors from four neuroblastoma patients with different clinobiological backgrounds: a high-risk (HR) tumor with MYCN amplification (MNA), non-HR tumor (numerical only genomic profile), non–MYCN-amplified tumor with a nonsense mutation in ARHGEF38, and benign ganglioneuroma tumor are shown. Images were acquired at 40× magnification except for p-ROCK2, which is at 60×. H/E, hematoxylin/eosin. (B) Quantification of active RhoA protein, expressed as percent of total RhoA in the matched patient sample, in the same four neuroblastoma patient (Pat) samples, analyzed with ELISA. Means of five determinations with SEM are displayed. (C) mRNA expression of ROCK1 and ROCK2 in neuroblastoma cell lines, assessed with real-time PCR. Data represent the mean with SD of three determinations. (D) Western blot analysis showing ROCK1 and ROCK2 protein levels in all tested neuroblastoma cell lines.
Fig. 2.
Fig. 2.
ROCK inhibition suppresses neuroblastoma growth. (A) IC50 (µM) for the Rho/Rac signaling inhibitors Y27632, HA1077, and Rhosin in a panel of neuroblastoma cell lines after a 72-h drug exposure. The ROCK inhibitor HA1077 showed significantly lower log IC50 than the ROCK inhibitor Y27632 and the Rho inhibitor Rhosin (repeated-measures one-way ANOVA, P = 0.0067; Y27632 vs. HA1077, P = 0.001; Rhosin vs. HA1077, P = 0.0457). (B) Dose–response curves for cell viability after 72 h of HA1077 treatment in eight neuroblastoma cell lines and one fibroblast cell line, MRC5 (used as a nontumorigenic control for drug toxicity). Cell viability was determined with WST-1; IC50 values are displayed (Right). The cell lines are labeled identically in A and B. (C) Tumorigenic capacity, shown as clonogenic forming ability, was inhibited in the three tested neuroblastoma cell lines after 96 h of HA1077 exposure. (D) The expression of phosphorylated MYPT1 was decreased in neuroblastoma cells following treatment with HA1077 (48 h), as shown by Western blotting. Quantification showed a ratio for p-MYPT1/total MYPT1 of 0.41 vs. 0.15. (E) siRNA-mediated down-regulation of ROCK2 (siROCK2) expression suppressed neuroblastoma cell viability 72 h after transfection compared with scrambled control (scrambl. control) [t test; SK-N-BE(2), ***P < 0.0001; SK-N-AS, ***P = 0.0003]. (F and G) The siRNA knockdown of ROCK2 was confirmed with quantitative PCR and Western blotting [t test; SK-N-BE(2), **P = 0.047; SK-N-AS, ***P = 0.0004]. All concentrations were tested in duplicates, and the experiments were repeated at least three times; mean (A) and mean with SD (B, C, E, and F) are displayed.
Fig. 3.
Fig. 3.
ROCK2 inhibition induces differentiation and inhibits proliferation and invasion in neuroblastoma cell lines. (A) Treatment of SK-N-BE(2) and SH-SY5Y neuroblastoma cells with HA1077 reduced the expression of cyclin D1 protein as shown by Western blotting. Quantification with densitometry demonstrated a ratio between cyclin D1 and loading control in SK-N-BE(2) of 1 (untreated) compared with 1.06 (25 µM) and 0.26 (50 µM) in HA1077-treated cells; corresponding quantification in SH-SH5Y showed 1 compared with 0.60 and 0.48. (B) Neural differentiation of SK-N-BE(2) and SH-SY5Y in response to HA1077 (50 μM, 72 h) and retinoic acid (ATRA; 1 µM, 72 h). Cells were stained with β3-tubulin and Hoechst 33342, and images were acquired using a confocal laser-scanning microscope (Leica; TCS SP5; 20× objective). (C) The number of cells with neurite outgrowth (>60 µm) was manually counted (ANOVA with Bonferroni posttest; SK-N-BE(2), P < 0.0001; control vs. HA1077, *P = 0.033; control vs. ATRA, ***P = 0.0003; SH-SY5Y, P = 0.0002; control vs. HA1077, ***P = 0.0002; control vs. ATRA, **P = 0.0065). Means with SD are shown. (D) Up-regulation of the differentiation markers β3-tubulin in HA1077-treated cells (72 h) and TrkA after silencing of ROCK2 (96 h) compared with controls. (E) HA1077 (50 µM) repressed the invasion ability of SK-N-BE(2) cells when studied in a real-time invasion analysis in cell chambers coated with 5% Matrigel, monitored in the xCELLigence real-time cell analysis system (two-way ANOVA, P = 0.049 for treatment over 30 h; Bonferroni posttest, P < 0.05 from time point 24 h). Means with SD of three independent experiments are displayed. (F) ROCK2 inhibition, by HA1077 or siRNA knockdown, inhibited neuroblastoma migration, shown as the relative area of migrated cells 18 h after scratching measured by wound assay. Means with SD of three independent experiments are shown [t test; SK-N-BE(2), *P = 0.031; SH-SY5Y, *P = 0.028; SK-N-BE(2) siRNA, **P = 0.0054].
Fig. 4.
Fig. 4.
HA1077 reduces neuroblastoma growth in vivo. (A) HA1077 significantly impaired the growth of established human neuroblastoma xenografts in NMRI nu/nu mice (t test, day 10, *P = 0.038; two-way ANOVA, regarding treatment, P = 0.016). Mice were engrafted with 10 × 106 SK-N-BE(2) cells s.c. and randomized to receive a daily i.p. injection of HA1077 (50 mg/kg; n = 8) or vehicle (n = 11) for 10 d, starting at the appearance of palpable tumors of ≈0.10 mm3 (mean 0.125 mm3). Means with SEM are displayed. (B) Tumor growth was significantly delayed in HA1077-treated animals, measured as time until tumor reached sixfold tumor volume (log-rank test, *P = 0.0301). (C) Cell proliferation was inhibited in tumors from mice treated with HA1077 compared with untreated controls, shown by tumor Ki-67 immunostaining (t test, *P = 0.033). Representative images and quantification, with means with SD, are shown. (D) Tumor weights from mice homozygous for the MYCN transgene (TH-MYCN+/+) treated with HA1077 [10 mg/kg (▪) or 25 mg/kg (♦); n = 11, mean 0.38 g] were significantly reduced after 10 d of treatment (starting at 4.5 wk of age) compared with matched control (n = 19; mean 1.28 g) (t test, ***P = 0.0001). Tumor weights from individual mice are shown, with lines representing the mean. (E) ROCK activity in TH-MYCN HA1077-treated tumors (n = 6) and control tumors (n = 3), measured by ROCK activity ELISA. Means with SD are presented.
Fig. 5.
Fig. 5.
Inhibition of ROCK2 promotes degradation of MYCN protein. (A and B) Immunohistochemistry analysis of MYCN expression in HA1077-treated mice carrying SK-N-BE(2) xenografts (A) or TH-MYCN mice (B) showed reduced levels of MYCN protein levels compared with nontreated tumors. Representative images (acquired at 20× magnification) are shown, including isotype controls. (C) Western blot analysis of MYCN expression in tumors from HA1077-treated TH-MYCN mice confirmed suppression of MYCN protein levels compared with tumors from untreated controls. (D) HA1077 exposure (50 µM, 96 h) reduced MYCN protein expression in SK-N-BE(2) cells. (E) Inhibition of ROCK2 mRNA expression by siRNA suppressed MYCN protein levels (72 h). (F) Relative expression of MYCN mRNA from the same TH-MYCN tumors as in C demonstrated no differences in mRNA levels of MYCN for HA1077-treated tumors compared with tumors from untreated mice (t test, P = 0.72). (G) No decrease in MYCN mRNA levels was observed in SK-N-BE(2) cells treated with HA1077. On the contrary, mRNA MYCN levels were increased (one-way ANOVA, P = 0.015; Bonferroni posttest: control vs. HA1077, 25 µM, P = 0.033; control vs. HA1077, 50 µM, P = 0.015). (H) Inhibition of ROCK2 mRNA expression by siRNA (72 h) induced no effect on MYCN mRNA in SK-N-BE(2) neuroblastoma cells (t test, P = 0.30). Protein levels were studied with Western blot (CE), and quantification of mRNA was assessed with real-time quantitative PCR (FH). Data are presented as means and SD of three determinations (FH). (I) IC50 (µM) for HA1077 was significantly lower in the SH-EP MYCN-inducible Tet21N cell line with constitutive overexpression of MYCN, compared with non–MYCN-induced cells (t test, **P = 0.003). Means with 95% confidence intervals are shown from four experiments, determined with WST-1.
Fig. 6.
Fig. 6.
ROCK inhibition induces GSK3β-mediated phosphorylation and degradation of MYCN protein. HA1077 decreased the protein expression of phosphorylated GSK3α/β (Ser21/9) (A) and increased phosphorylated MYCN (T58) (B) in neuroblastoma cells, determined with Western blotting (72 h).

References

    1. Johnsen JI, Kogner P, Albihn A, Henriksson MA. Embryonal neural tumours and cell death. Apoptosis. 2009;14:424–438. - PubMed
    1. Maris JM. Recent advances in neuroblastoma. N Engl J Med. 2010;362:2202–2211. - PMC - PubMed
    1. Brodeur GM. Neuroblastoma: Biological insights into a clinical enigma. Nat Rev Cancer. 2003;3:203–216. - PubMed
    1. Cheung NK, et al. St Jude Children’s Research Hospital–Washington University Pediatric Cancer Genome Project Association of age at diagnosis and genetic mutations in patients with neuroblastoma. JAMA. 2012;307:1062–1071. - PMC - PubMed
    1. Molenaar JJ, et al. Sequencing of neuroblastoma identifies chromothripsis and defects in neuritogenesis genes. Nature. 2012;483:589–593. - PubMed

Publication types