. 2017 Aug 8;114(32):E6556-E6565.
doi: 10.1073/pnas.1703791114. Epub 2017 Jul 24.

CDCP1 drives triple-negative breast cancer metastasis through reduction of lipid-droplet abundance and stimulation of fatty acid oxidation

Affiliations

CDCP1 drives triple-negative breast cancer metastasis through reduction of lipid-droplet abundance and stimulation of fatty acid oxidation

Heather J Wright et al. Proc Natl Acad Sci U S A. .

Abstract

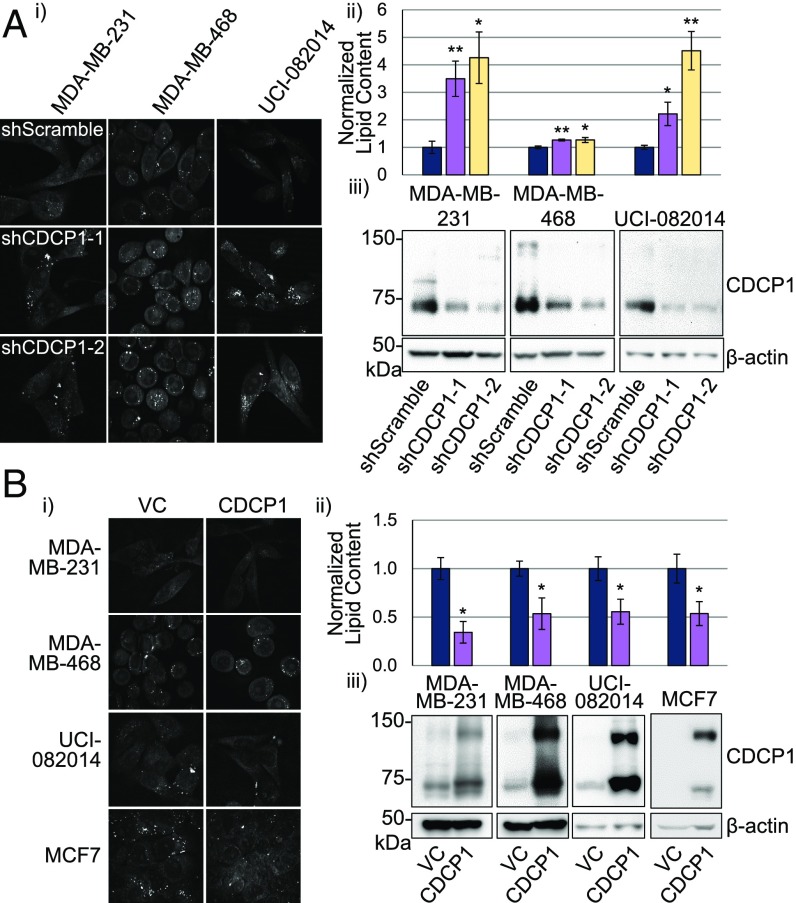
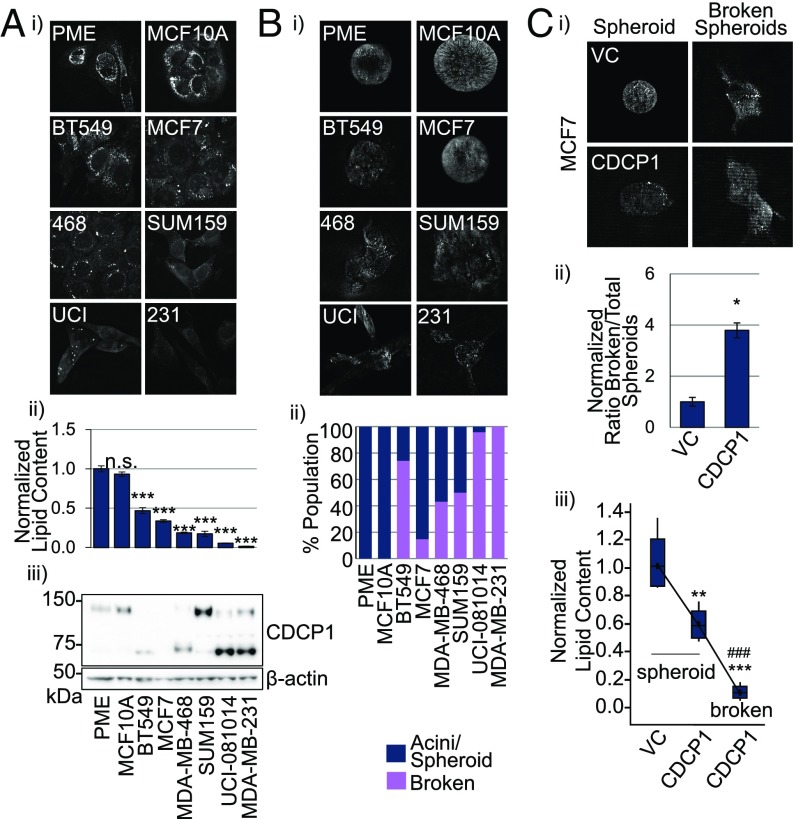
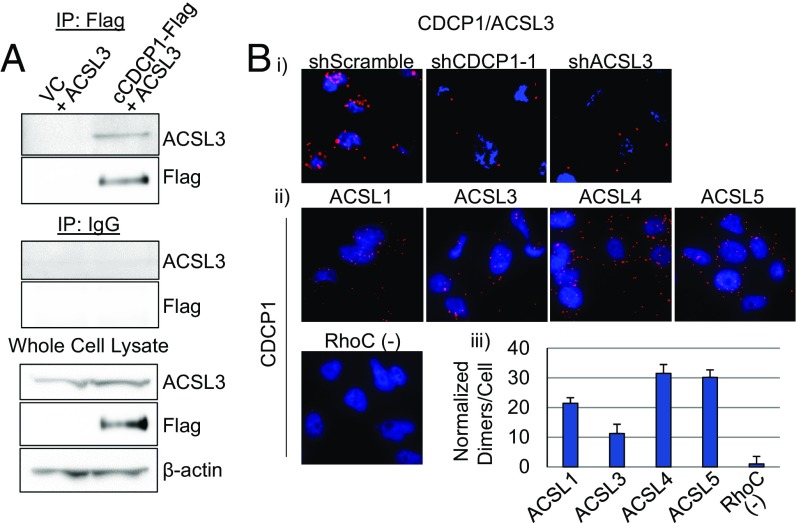
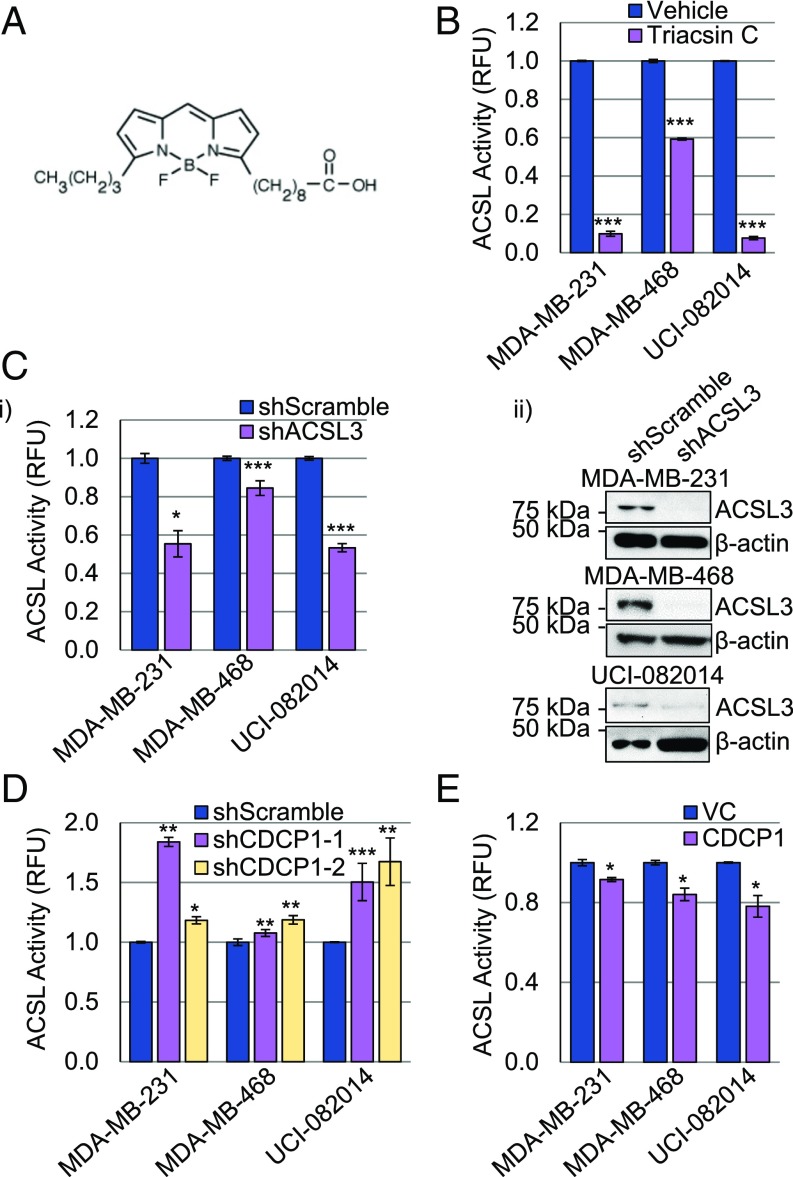
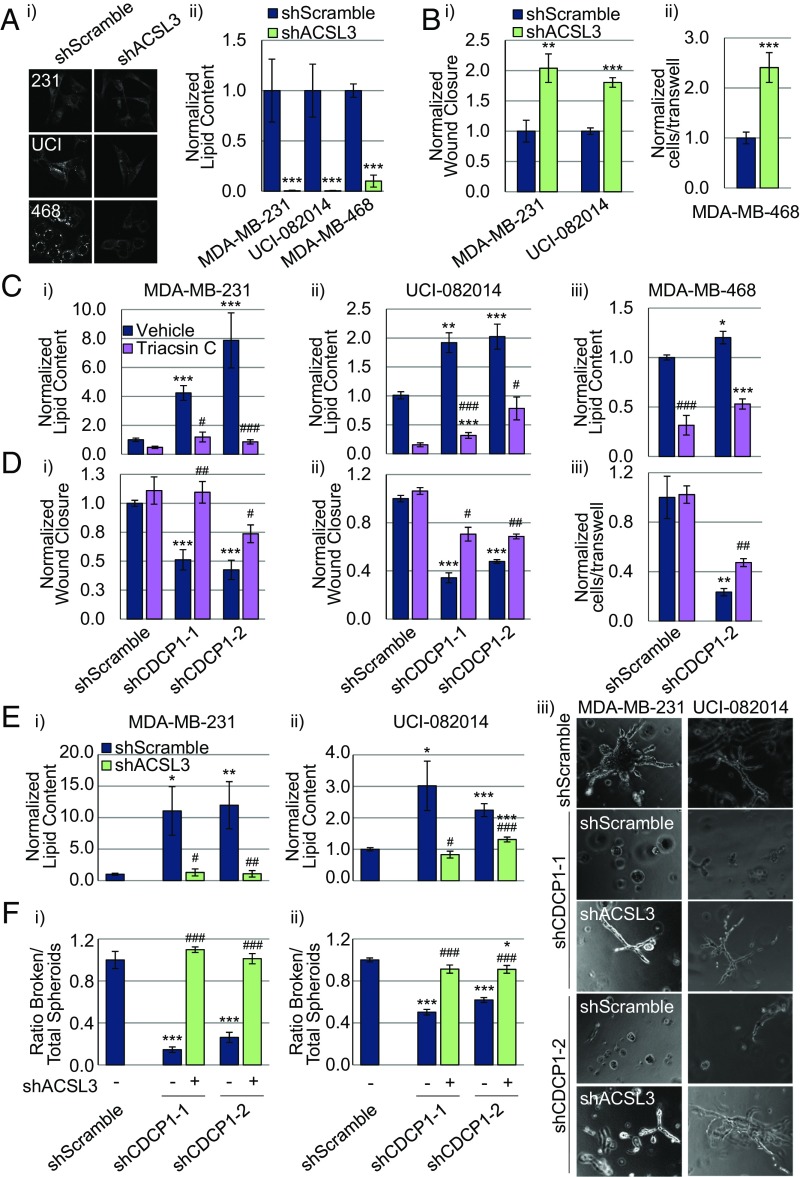
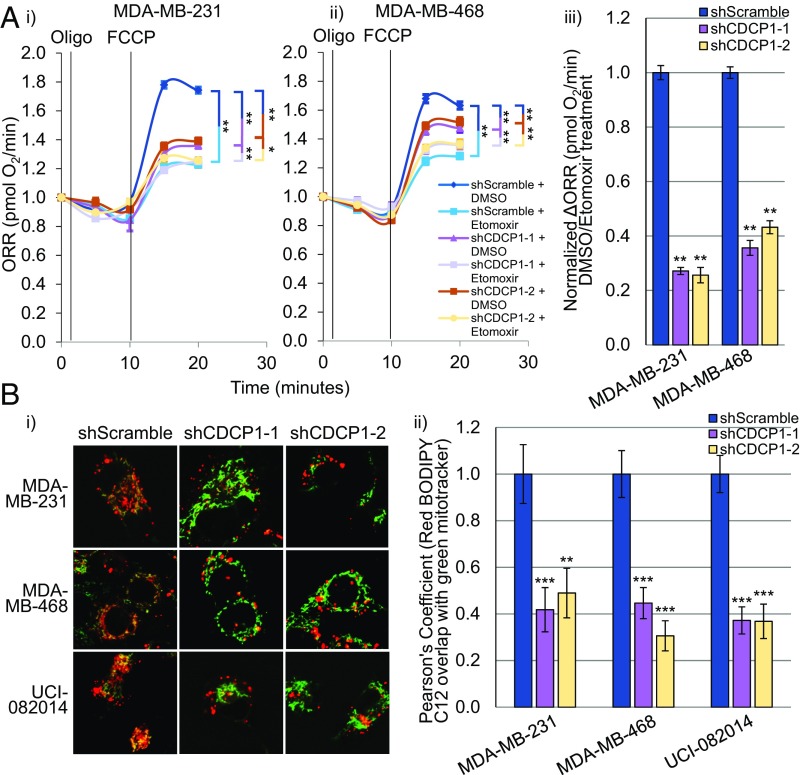
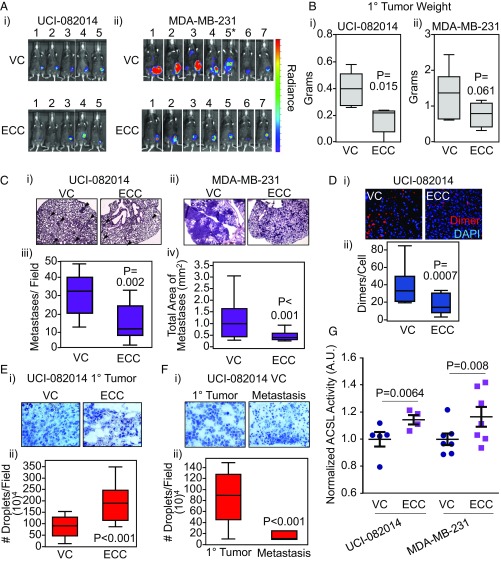
Triple-negative breast cancer (TNBC) is notoriously aggressive with high metastatic potential, which has recently been linked to high rates of fatty acid oxidation (FAO). Here we report the mechanism of lipid metabolism dysregulation in TNBC through the prometastatic protein, CUB-domain containing protein 1 (CDCP1). We show that a "low-lipid" phenotype is characteristic of breast cancer cells compared with normal breast epithelial cells and negatively correlates with invasiveness in 3D culture. Using coherent anti-Stokes Raman scattering and two-photon excited fluorescence microscopy, we show that CDCP1 depletes lipids from cytoplasmic lipid droplets (LDs) through reduced acyl-CoA production and increased lipid utilization in the mitochondria through FAO, fueling oxidative phosphorylation. These findings are supported by CDCP1's interaction with and inhibition of acyl CoA-synthetase ligase (ACSL) activity. Importantly, CDCP1 knockdown increases LD abundance and reduces TNBC 2D migration in vitro, which can be partially rescued by the ACSL inhibitor, Triacsin C. Furthermore, CDCP1 knockdown reduced 3D invasion, which can be rescued by ACSL3 co-knockdown. In vivo, inhibiting CDCP1 activity with an engineered blocking fragment (extracellular portion of cleaved CDCP1) lead to increased LD abundance in primary tumors, decreased metastasis, and increased ACSL activity in two animal models of TNBC. Finally, TNBC lung metastases have lower LD abundance than their corresponding primary tumors, indicating that LD abundance in primary tumor might serve as a prognostic marker for metastatic potential. Our studies have important implications for the development of TNBC therapeutics to specifically block CDCP1-driven FAO and oxidative phosphorylation, which contribute to TNBC migration and metastasis.

Keywords: CDCP1; FAO; TNBC; lipid droplets; metastasis.


Conflict of interest statement

The authors declare no conflict of interest.

Figures

Fig. 1.
Fig. 1.
CDCP1 lowers intracellular LD abundance of breast cancer cells. (A) CDCP1 knockdown increases LD abundance in three TNBC cell lines: (i) representative 40× CARS images; (ii) quantitation of CARS; (iii) Western blot confirming CDCP1 knockdown. (B) CDCP1 overexpression decreases LD abundance in three TNBC cell lines and ER+ MCF7 breast cancer cell line not expressing endogenous CDCP1: (i) representative 40× CARS images; (ii) quantitation of CARS; (iii) Western blot confirming CDCP1 overexpression. n = 3 for A and B. P values analyzed by one-way ANOVA with multiple comparison post hoc t test and error bars represent SEMs; *P < 0.05, **P < 0.01. shScr, shScramble; shC1 & 2, shCDCP1-1 and 2.
Fig. 2.
Fig. 2.
Expression of cleaved CDCP1 isoform correlates with breast cancer cell invasiveness and causes appearance of low-lipid broken acini in 3D culture. (A) The LD abundance is lower in breast cancer cells compared with PME and nontumorigenic breast epithelial (MCF10A) cells in 2D culture. (i) Representative 40× CARS images; (ii) quantitation of CARS, statistics based on comparison with PME; (iii) Western blot of CDCP1 expression. (B) Lower LD abundance correlates with invasiveness in 3D culture. (i) Representative 40× CARS images of breast cancer cell lines in 3D culture; (ii) quantitation of intact acini (PME and MCF10A), intact spheroids and broken spheroids (breast cancer cell lines). (C) CDCP1 overexpression in MCF7 cells promotes invasion observed as broken spheroids in 3D culture, which have lower LD content than intact spheroids. (i) Representative 40× CARS images; (ii) quantitation of the ratio of broken spheroids to total spheroids in VC- and CDCP1-transduced MCF7 cells; (iii) quantitation of LD abundance in spheroids formed by VC- and CDCP1-transduced MCF7 and broken spheroids formed by CDCP1-transduced MCF7 cells. n = 3 in A, ii and C, iii. P values analyzed by one-way ANOVA with multiple comparison post hoc t test and error bars represent SEMs; *P < 0.05, **P < 0.01, ***P < 0.001 compared with VC; ###P < 0.001 compared with CDCP1 spheroids.
Fig. 3.
Fig. 3.
CDCP1 interacts with ACSL family of proteins involved in lipid metabolism. (A) CDCP1 coimmunoprecipitates with ACSL3 in HEK 293T cells overexpressing ACSL3 and Flag-tagged cleaved CDCP1. (B) 40× images of PLA conducted in MDA-MB-231 cells demonstrating that (i) CDCP1 interacts with ACSL3 endogenously (negative controls: shCDCP1-1– and shACSL3-transduced cells); (ii) CDCP1 interacts with ACSL family members endogenously; negative control: anti-CDCP1 + anti-RhoC antibody pair, based on no reports of CDCP1 and RhoC interaction; and (iii) quantitation of PLA in ii.
Fig. 4.
Fig. 4.
CDCP1 regulates ACSL activity. (A) Structure of BODIPY used for ACSL activity assays. (B and C) Validation of ACSL activity assay in TNBC cells. (B) Triacsin C (5 μM) reduces ACSL activity compared with DMSO vehicle. (C, i) ACSL3 knockdown reduces ACSL activity; (ii) Western blot confirming ACSL3 knockdown. (D) CDCP1 knockdown increases ACSL activity in TNBC cells. (E) CDCP1 overexpression decreases ACSL activity in TNBC cells. P values analyzed by one-way ANOVA with multiple comparison post hoc t test and error bars represent SEMs; *P < 0.05, **P < 0.01, ***P < 0.001. Quantitation is the average of an n ≥ 3 for each panel. RFU, relative fluorescence units.
Fig. 5.
Fig. 5.
Low-lipid content favors promigratory phenotype of TNBC. (A) ACSL3 knockdown reduces LD abundance in TNBC cell lines: (i) representative 40× CARS images; (ii) quantitation of CARS. (B) ACSL3 knockdown increases migration of MDA-MB-231 and UCI-082014 (i) and MDA-MB-468 (ii) cells. (C and D) CDCP1 knockdown increases LD abundance (C) and reduces migration (D) in MDA-MB-231 (i), UCI-082014 (ii), and MDA-MB-468 cells (iii), and 5 μM Triacsin C treatment for 16 h (lowering lipids) partially rescues migration of shCDCP1-transduced cells. (E and F) Increase in LD abundance (E) and reduction in invasion (F) by CDCP1 knockdown can be rescued by co-knockdown of ACSL3. (E) Quantitation of LD abundance measured by Oil Red O (ORO) staining. (F) Quantitation of the ratio of broken/total spheroids in MDA-MB-231 (i) and UCI-082014 (ii) 3D cultures. (iii) Representative 20× phase-contrast images of 3D MDA-MB-231 and UCI-082014 cultures. n = 3 for A–F. P values analyzed by one-way ANOVA with multiple comparison post hoc t test and error bars represent SEMs. *P < 0.05, **P < 0.01, ***P < 0.001 compared with respective vehicle-treated shScramble cells; #P < 0.05, ##P < 0.01, ###P < 0.001 compared with respective vehicle-treated shCDCP1 cells.
Fig. 6.
Fig. 6.
CDCP1 knockdown reduces FAO in TNBC cells. (A) CDCP1 knockdown reduces FAO as measured by ORR in MDA-MB-231 (i) and MDA-MB-468 (ii) cells. Oligomycin (Oligo, ATP synthase inhibitor) followed by carbonyl cyanide-4-phenylhydrazone (FCCP, ATP synthesis uncoupler) treatment allowed measurement of maximum respiration potential. Etomoxir (FAO inhibitor, blocking transport of FAs into the mitochondria) treatment allowed measurement of FAO fueled by FAs already present in mitochondria. (iii) shCDCP1-transduced cells have lower ΔORR [calculated as 1 (DMSO-treated ORR/Etomoxir-treated ORR) and then all data were normalized to shScramble control, which was set to 1] than shScramble-transduced cells, indicating that CDCP1 knockdown reduces lipid stores in the mitochondria available for FAO. (B) Representative 63× images (i) and quantitation (ii) of colocalization of red BODIPY C12 (lipids) with green MitoTracker (mitochondria), indicating that less lipids colocalize with the mitochondria 16 h after BODIPY C12 addition. n = 3 for A and B. P values analyzed by one-way ANOVA with multiple comparison post hoc t test and error bars represent SEMs; *P < 0.05, **P < 0.01, ***P < 0.001.
Fig. 7.
Fig. 7.
Expression of a CDCP1-blocking fragment, ECC, increases LD abundance and reduces metastasis. (A) Representative images of mice with luciferase-labeled UCI-082014 (i) or MDA-MB-231 (ii) tumors at week 5 and 8 posttumor implantation, respectively. *VC-5 killed 2 wk early because of extensive disease progression and visibly reduced quality of life. (B) ECC reduces primary (1°) tumor growth of UCI-082014 (i) and trends toward reducing 1° tumor growth of MDA-MB-231 (ii) cells implanted into the fat pad of Rag2−/− mice. (C) ECC expression reduces lung metastasis of UCI-082014 and MDA-MB-231 tumors. (i and ii) Representative 4× images of H&E-stained lungs from mice implanted with UCI-082014 (i), metastases are shown by arrowheads, and MDA-MB-231 (ii) cells. (iii and iv) Quantitation of UCI-082014 (iii) and MDA-MB-231 (iv) metastasis. (D) ECC reduces CDCP1 dimer formation in 1° tumors as assessed by PLA. Representative 20× images (i) and quantitation (ii) of PLA. (E) ECC increases LD abundance in 1° tumors. Representative 20× images (i) and quantitation (ii) of Oil Red O (ORO) staining. (F) VC-transduced 1° tumors have higher LD abundance than the corresponding metastatic nodules. Representative 20× images (i) and quantitation (ii) of ORO staining. (G) ECC stimulates ACSL activity in 1° tumors. Quantitation of ACSL activity in VC- and ECC-transduced UCI-082014 and MDA-MB-231 primary tumor tissue. Each point represents an individual tumor. P values (as indicated) analyzed by one-way ANOVA with multiple comparison post hoc t test and error bars represent SEMs. A.U., arbitrary units.

References

    1. Razorenova OV, et al. VHL loss in renal cell carcinoma leads to up-regulation of CUB domain-containing protein 1 to stimulate PKCdelta-driven migration. Proc Natl Acad Sci USA. 2011;108:1931–1936. - PMC - PubMed
    1. Emerling BM, et al. Identification of CDCP1 as a hypoxia-inducible factor 2α (HIF-2α) target gene that is associated with survival in clear cell renal cell carcinoma patients. Proc Natl Acad Sci USA. 2013;110:3483–3488. - PMC - PubMed
    1. He Y, et al. Elevated CDCP1 predicts poor patient outcome and mediates ovarian clear cell carcinoma by promoting tumor spheroid formation, cell migration and chemoresistance. Oncogene. 2016;35:468–478. - PubMed
    1. Vlad C, Kubelac P, Onisim A, Irimie A, Achimas-Cadariu P. The role of CDCP1 (CUB domain-containing protein 1) and ADAM12 (a disintegrin and metalloproteinase 12) in ovarian cancer. J BUON. 2015;20:673–679. - PubMed
    1. Casar B, et al. Blocking of CDCP1 cleavage in vivo prevents Akt-dependent survival and inhibits metastatic colonization through PARP1-mediated apoptosis of cancer cells. Oncogene. 2012;31:3924–3938. - PMC - PubMed

Publication types

MeSH terms