

Phylodynamics of major CRF01_AE epidemic clusters circulating in mainland of China
- PMID: 28740095
- PMCID: PMC5524839
- DOI: 10.1038/s41598-017-06573-6
Phylodynamics of major CRF01_AE epidemic clusters circulating in mainland of China
Abstract
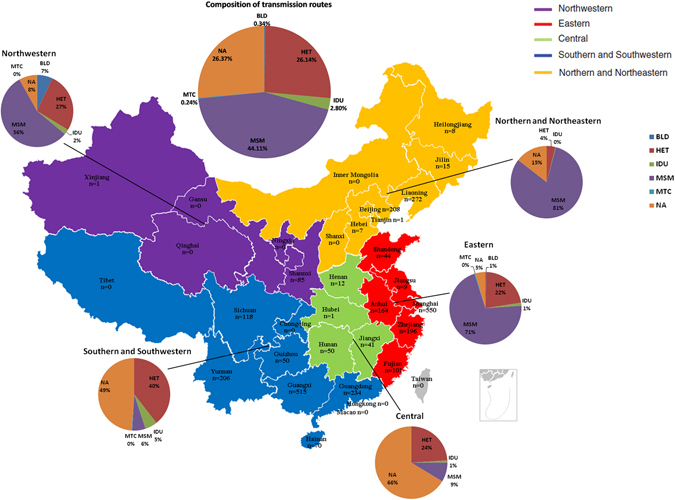
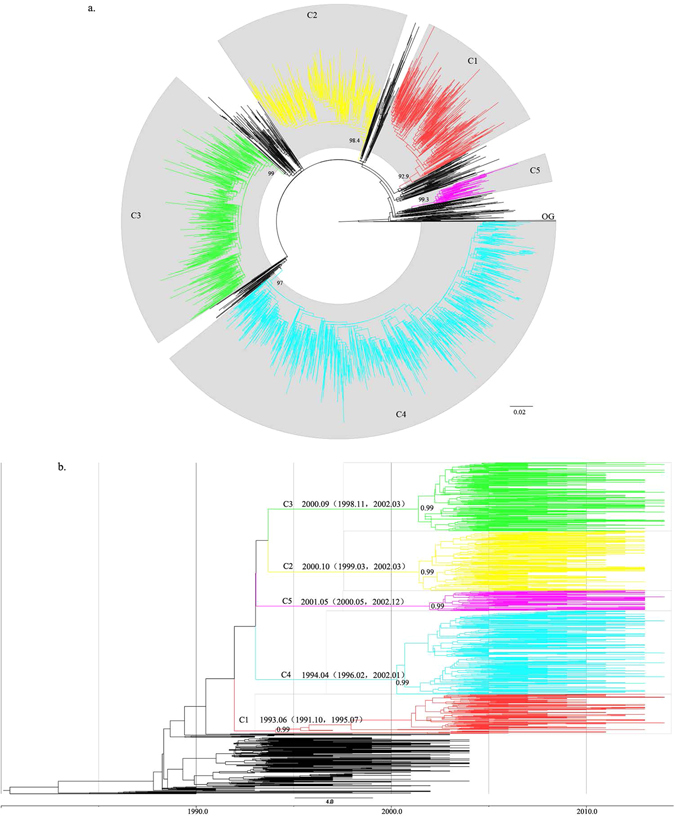
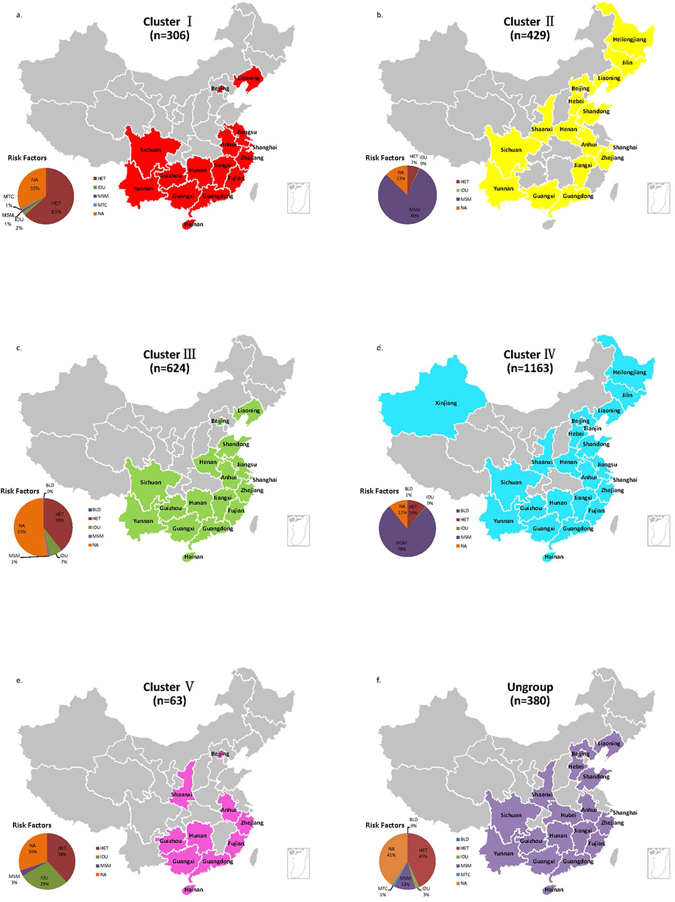
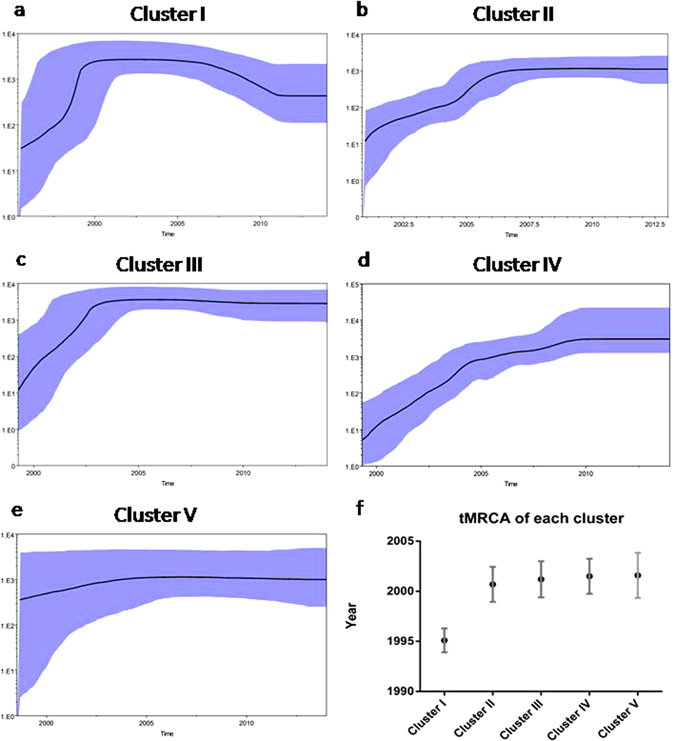
As the most dominant HIV-1 strain in China, CRF01_AE needs to have its evolutionary and demographic history documented. In this study, we provide phylogenetic analysis of all CRF01_AE pol sequences identified in mainland China. CRF01_AE sequences were collected from the Los Alamos HIV Sequence Database and the local Chinese provincial centers of disease control and prevention. Phylogenetic trees were constructed to identify major epidemic clusters. Bayesian coalescent-based method was used to reconstruct the time scale and demographic history. There were 2965 CRF01_AE sequences from 24 Chinese provinces that were collected, and 5 major epidemic clusters containing 85% of the total CRF01_AE sequences were identified. Every cluster contains sequences from more than 10 provinces with 1 or 2 dominant transmission routes. One cluster arose in the 1990s and 4 clusters arose in the 2000s. Cluster I is in the decline stage, while the other clusters are in the stable stage. Obvious lineage can be observed among sequences from the same transmission route but not the same area. Two large clusters in high-level prevalence were found in MSM (Men who have sex with men), which highlighted that more emphasis should be placed on MSM for HIV control in mainland China.
Conflict of interest statement
The authors declare that they have no competing interests.
Figures
Similar articles
-
The Epidemic Dynamics of Four Major Lineages of HIV-1 CRF01_AE Strains After Their Introduction into China.AIDS Res Hum Retroviruses. 2016 May;32(5):420-6. doi: 10.1089/AID.2015.0212. Epub 2016 Mar 16. AIDS Res Hum Retroviruses. 2016. PMID: 26830205
-
Phylogenetic and temporal dynamics of human immunodeficiency virus type 1 CRF01_AE and CRF07_BC among recently infected antiretroviral therapy-naïve men who have sex with men in Jiangsu province, China, 2012 to 2015: A molecular epidemiology-based study.Medicine (Baltimore). 2018 Feb;97(6):e9826. doi: 10.1097/MD.0000000000009826. Medicine (Baltimore). 2018. PMID: 29419684 Free PMC article.
-
[Analysis on gene sequence of HIV isolated from men who have sex with men in Beijing].Zhonghua Liu Xing Bing Xue Za Zhi. 2015 Sep;36(9):988-93. Zhonghua Liu Xing Bing Xue Za Zhi. 2015. PMID: 26814868 Chinese.
-
The Emerging of CRF01_AE: A Clinical Story and Future HIV/AIDS Situation in Thailand.Curr HIV Res. 2020;18(2):74-84. doi: 10.2174/1570162X18666200129160723. Curr HIV Res. 2020. PMID: 31995011 Review.
-
Prevalence and spatiotemporal dynamics of HIV-1 Circulating Recombinant Form 03_AB (CRF03_AB) in the Former Soviet Union countries.PLoS One. 2020 Oct 23;15(10):e0241269. doi: 10.1371/journal.pone.0241269. eCollection 2020. PLoS One. 2020. PMID: 33095842 Free PMC article.
Cited by
-
Transmission network and phylogenetic analysis reveal older male-centered transmission of CRF01_AE and CRF07_BC in Guangxi, China.Emerg Microbes Infect. 2023 Dec;12(1):2147023. doi: 10.1080/22221751.2022.2147023. Emerg Microbes Infect. 2023. PMID: 36369697 Free PMC article.
-
Comparative Circulation Dynamics of the Five Main HIV Types in China.J Virol. 2020 Nov 9;94(23):e00683-20. doi: 10.1128/JVI.00683-20. Print 2020 Nov 9. J Virol. 2020. PMID: 32938762 Free PMC article.
-
Long-Acting HIV-1 Fusion Inhibitory Peptides and their Mechanisms of Action.Viruses. 2019 Sep 2;11(9):811. doi: 10.3390/v11090811. Viruses. 2019. PMID: 31480738 Free PMC article.
-
National and Regional Molecular Epidemiology of HIV-1 - China, 2004-2023.China CDC Wkly. 2024 Nov 29;6(48):1257-1263. doi: 10.46234/ccdcw2024.252. China CDC Wkly. 2024. PMID: 39698329 Free PMC article.
-
Cross-Continental Dispersal of Major HIV-1 CRF01_AE Clusters in China.Front Microbiol. 2020 Jan 31;11:61. doi: 10.3389/fmicb.2020.00061. eCollection 2020. Front Microbiol. 2020. PMID: 32082287 Free PMC article.
References
-
- Zeng Y, et al. Detection of antibody to LAV/HTLV-III in sera from hemophiliacs in China. AIDS Res. 1986;2(Suppl 1):S147–149. - PubMed
-
- 2011 Estimates for the HIV/AIDS Epidemic in China. (Ministry of Health, People’s Republic of China Joint United Nations Programme on HIV/AIDS World Health Organization, 2011).
-
- Sun X, Nan J, Guo Q. AIDS and HIV infection in China. AIDS. 1994;8(Suppl 2):S55–59. - PubMed
Publication types
MeSH terms
Substances
LinkOut - more resources
Full Text Sources
Other Literature Sources
Medical
Research Materials
