. 2017 Jul 24;7(1):6270.
doi: 10.1038/s41598-017-06620-2.

Host seeking parasitic nematodes use specific odors to assess host resources

Affiliations

Host seeking parasitic nematodes use specific odors to assess host resources

Tiffany Baiocchi et al. Sci Rep. .

Abstract

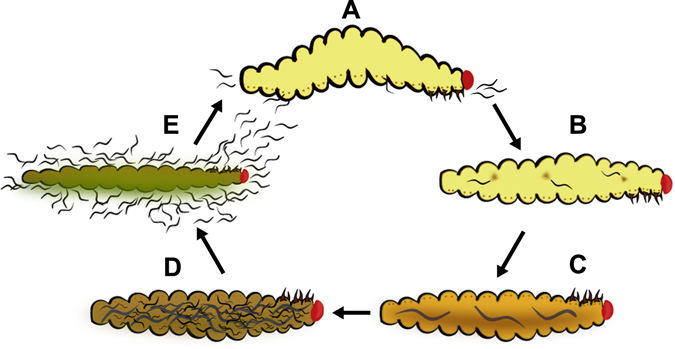
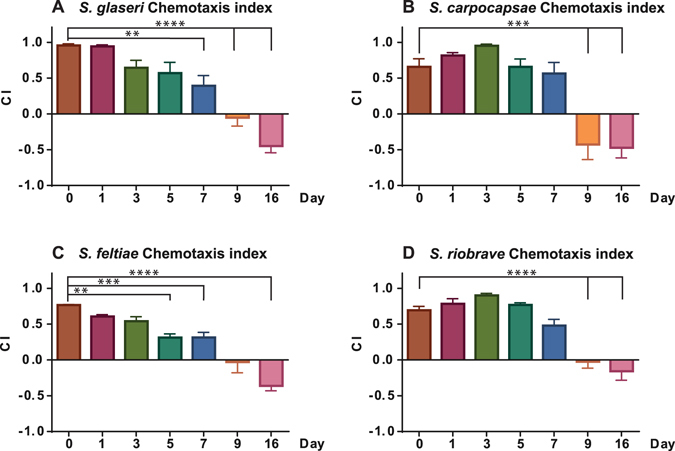
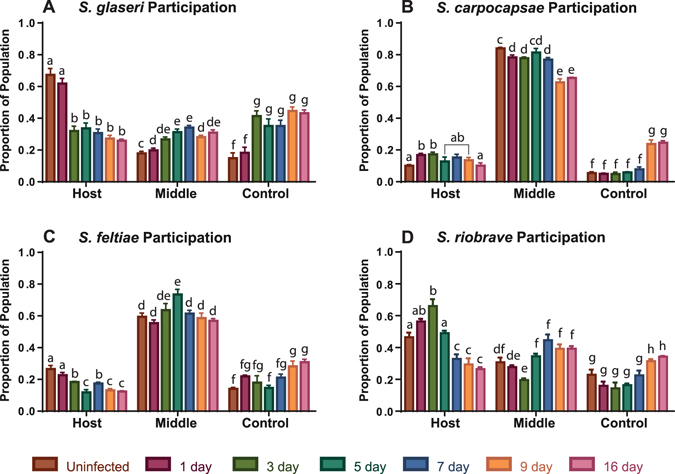
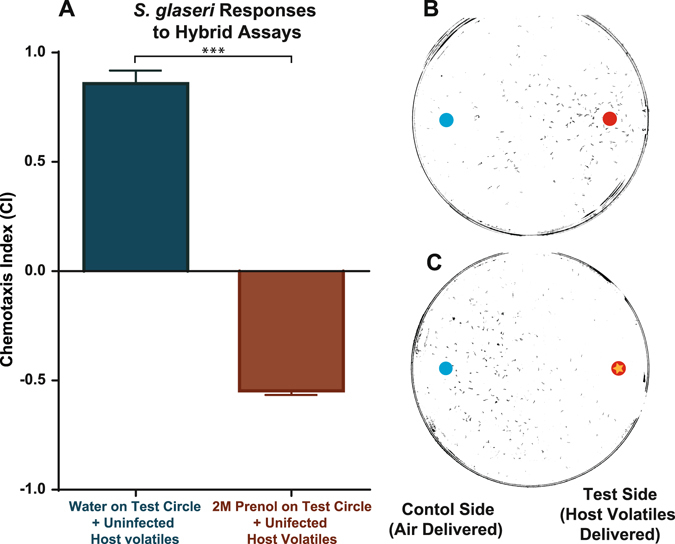
Entomopathogenic nematodes (EPNs) are insect parasites used as biological control agents. Free-living infective juveniles (IJs) of EPNs employ host-seeking behaviors to locate suitable hosts for infection. We found that EPNs can differentiate between naïve and infected hosts, and that host attractiveness changes over time in a species-specific manner. We used solid-phase microextraction and gas chromatography/mass spectrometry to identify volatile chemical cues that may relay information about a potential host's infection status and resource availability. Among the chemicals identified from the headspace of infected hosts, 3-Methyl-2-buten-1-ol (prenol) and 3-Hydroxy-2-butanone (AMC) were selected for further behavioral assays due to their temporal correlation with the behavioral changes of IJs towards the infected hosts. Both compounds were repulsive to IJs of Steinernema glaseri and S. riobrave in a dose-dependent manner when applied on an agar substrate. Furthermore, the repulsive effects of prenol were maintained when co-presented with the uninfected host odors, overriding attraction to uninfected hosts. Prenol was attractive to dauers of some free-living nematodes and insect larvae. These data suggest that host-associated chemical cues may have several implications in EPN biology, not only as signals for avoidance and dispersal of conspecifics, but also as attractants for new potential hosts.


Conflict of interest statement

The authors declare that they have no competing interests.

Figures

Figure 1
Figure 1
The EPN life cycle. (A) Uninfected host is infected with infective juveniles (IJs). (B) IJs invade and release symbiotic bacteria. (C) The bacteria proliferates and IJs mature into adulthood. (D) Adults produce progeny. (E) Eventually resources run out and newly emerging IJs disperse from depleted cadaver.
Figure 2
Figure 2
Chemotaxis indices shown for the four species of Steinernema EPN IJs. CI values near: +1.0 indicate high attraction, near zero indicate indifference, and near −1.0 indicate high repulsion. Statistical significance was evaluated using an unpaired, ordinary, one-way ANOVA with Tukey’s multiple comparisons post-test. Error bars represent SEM. **P < 0.01; ***P < 0.001; ****P < 0.0001.
Figure 3
Figure 3
Participation values for four species of Steinernema EPN IJs. Participation values were derived from separating the plate into three sections and scoring nematodes that had moved directionally 1 cm either towards the side where host volatiles or control air was being delivered. Those that did not move directionally out of the center (by at least 1 cm) were scored as remaining in the middle. Statistical analysis was done using an unpaired, ordinary one-way ANOVA evaluation for data points within–but not between–each group of “Host”, “Middle”, and “Control”. Bars with the same letter values are not significantly different. For breakdown of the scoring template please see Fig. 4. Error bars represent SEM.
Figure 4
Figure 4
Template used in chemotaxis assays. The scoring circles indicate where volatiles were delivered (for insect-odor response assays) or where odorants were applied (for chemical response assays). Scoring circles were used to count nematodes and calculate chemotaxis indices (CI values), while the 3 designated sides (test, middle and control) were used to determine participation.
Figure 5
Figure 5
Panels A,B: Results from GC-MS of (A) S. glaseri and (B) S. riobrave infected G. mellonella hosts. Numbers represent integration values of peaks. This reflects the overall relative abundance of individual odors. Here we found that most odors are appeared in highest abundance at 16 days post infection (dpi), however two chemicals–AMC and prenol–stood out by appearing at earlier time points. 3-Hydroxy-2-butanone (AMC) is found in association with S. glaseri-infected hosts at 1 dpi and 16 dpi. 3-Methyl-2-buten-1-ol (prenol) is found in both S. riobrave and S. glaseri infected hosts, and appears at 1dpi (for S. riobrave-infected hosts only) as well as at 3 dpi, and 16 dpi in both S. riobrave and S. glaseri-infected hosts. Panels C,D: Results of dose response curves for (C) 3-Methyl-2-buten-1-ol (prenol) and (D) 3-Hydroxy-2-butanone (AMC). These show the responses of both S. glaseri and S. riobrave IJs to various concentrations of these chemicals. It is worth noting that the concentrations listed are what was applied to the experimental arena, but are certainly higher than the concentration experienced by the nematodes. Error Bars represent SEM.
Figure 6
Figure 6
Multi-Species response to prenol. (A) Chemotaxis indices for Caenorhabditis elegans (dauers) (C. e.) Drosophila melanogaster (larvae) (D. m.), Levipalatum texanum (dauers) (L.t.), S. riobrave IJs (S. r.), S. glaseri IJs (S. g.). (B) The participation values of each of the species tested in (A). (C) A representative photo of D. melanogaster larvae in response to 200 mM prenol. Star indicates location of prenol (diluted to 200 mM in paraffin oil).
Figure 7
Figure 7
Hybrid Assay results. (A) Chemotaxis index for hybrid assays done with S. glaseri IJs. Statistical analysis done using a two-tailed, paired, parametric t-test. Error bars represent SEM, ***P < 0.001 (B) A representative photo of a control hybrid assay using volatile and soluble cues, in this experiment 5 µl of ultrapure water was placed on the agar plate underneath where uninfected host volatiles were being delivered. The blue dot (on left side of the plate) represents the location of where air from control syringe was delivered, and the red dot (on right side of the plate) represents where volatiles from uninfected hosts was delivered. (C) A representative photo of a hybrid assay where 5 µl 2 M prenol–diluted in ultra-pure water–was added to the test circle–where uninfected host volatiles were being delivered. The combination of prenol and uninfected host volatiles is indicated by red dot with gold star. The blue dot (on left side of plate) indicates where air from control syringe was being delivered. Error bars represent SEM. ***P < 0.001.

References

    1. Georgis R, et al. Successes and failures in the use of parasitic nematodes for pest control. Biological Control. 2006;38:103–123. doi: 10.1016/j.biocontrol.2005.11.005. - DOI
    1. Grewal, P. & Georgis, R. Entomopathogenic nematodes. Biopesticides: use and delivery, 271–299 (1999).
    1. Kaya HK, Gaugler R. Entomopathogenic nematodes. Annual Review of Entomology. 1993;38:181–206. doi: 10.1146/annurev.en.38.010193.001145. - DOI
    1. Peters A. Application and commercialization of nematodes. Appl Microbiol Biotechnol. 2013;97:6181–6188. doi: 10.1007/s00253-013-4941-7. - DOI - PubMed
    1. Adams, B. J. & Nguyen, K. B. In Entomopathogenic Nematology Vol. CABI Publishing (ed. R., Gaugler) Ch. 1, 1–33 (2002).

Publication types

Substances