

Recent Warming and Cooling in the Antarctic Peninsula Region has Rapid and Large Effects on Lichen Vegetation
- PMID: 28740147
- PMCID: PMC5524963
- DOI: 10.1038/s41598-017-05989-4
Recent Warming and Cooling in the Antarctic Peninsula Region has Rapid and Large Effects on Lichen Vegetation
Abstract
The Antarctic Peninsula has had a globally large increase in mean annual temperature from the 1951 to 1998 followed by a decline that still continues. The challenge is now to unveil whether these recent, complex and somewhat unexpected climatic changes are biologically relevant. We were able to do this by determining the growth of six lichen species on recently deglaciated surfaces over the last 24 years. Between 1991 and 2002, when mean summer temperature (MST) rose by 0.42 °C, five of the six species responded with increased growth. MST declined by 0.58 °C between 2002 and 2015 with most species showing a fall in growth rate and two of which showed a collapse with the loss of large individuals due to a combination of increased snow fall and longer snow cover duration. Increased precipitation can, counter-intuitively, have major negative effects when it falls as snow at cooler temperatures. The recent Antarctic cooling is having easily detectable and deleterious impacts on slow growing and highly stress-tolerant crustose lichens, which are comparable in extent and dynamics, and reverses the gains observed over the previous decades of exceptional warming.
Conflict of interest statement
The authors declare that they have no competing interests.
Figures

 ), Bellemerea sp. (
 ), Buellia latemarginata (
 ), Caloplaca sublobulata (
 ), Rhizocarpon geographicum, (
 ) and the fruticose lichen Usnea antarctica (
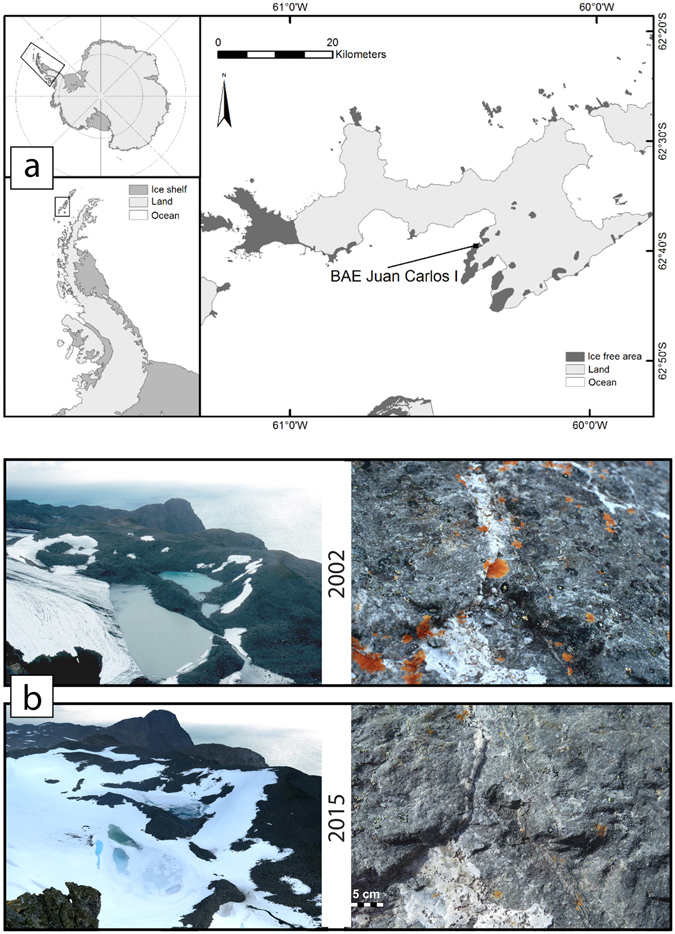
 ) from measurements in 1991 (from new surface to 1991, 34 years), 2002 (1991 to 2002, 11 years), and 2015 (2002 to 2015, 13 years) and mean summer (January, February and December) temperatures for the same periods in Bellingshausen Antarctic Base, King George Island (
 ) (a) and annual growth rates for the same species related to mean summer temperature in Bellingshausen for the same periods (b).
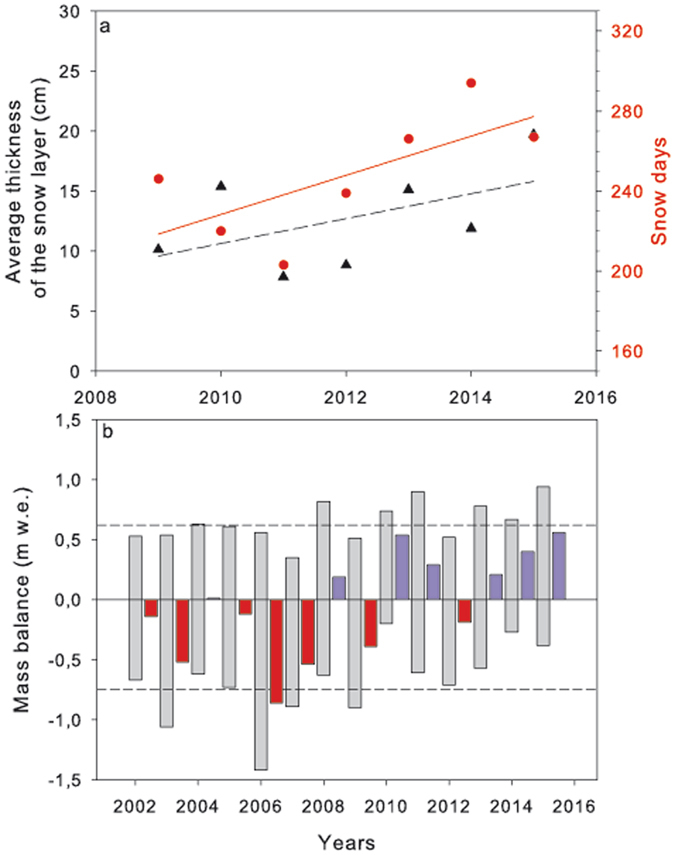
 , r2 = 0.278) and number of days with snow (
 , r2 = 0.471) in the last 7 years (a) and surface mass balance series of Hurd Glacier (b). The grey bars represent the mass balances (positive values, winter balance and negative values, summer balances) and the red/blue bars to their right the resulting annual balances: red if negative (net mass loss), blue if positive (net mass gain). The dashed lines represent the 14-year averages for winter and summer balances. Years shown are southern hemisphere hydrological years.
References
-
- Pachauri, R. K. et al. Climate Change 2014: Synthesis Report. Contribution of Working Groups I, II and III to the Fifth Assessment Report of the Intergovernmental Panel on Climate Change [Core Writing Team, Pachauri, R. K. & Meyer, L. A. (eds)]. IPCC, Geneva, Switzerland, 151 pp (2014).
-
- Cannone N, Guglielmin M, Convey P, Worland MR, Longo SF. Vascular plant changes in extreme environments: effects of multiple drivers. Climatic Change. 2016;134:651–665. doi: 10.1007/s10584-015-1551-7. - DOI
-
- Bokhorst S, Convey P, Huiskes A, Aerts R. Usnea antarctica, an important Antarctic lichen, is vulnerable to aspects of regional environmental change. Polar Biol. 2016;39:511–521. doi: 10.1007/s00300-015-1803-z. - DOI
Publication types
MeSH terms
LinkOut - more resources
Full Text Sources
Other Literature Sources
