. 2017 Jul 24;8(1):106.
doi: 10.1038/s41467-017-00127-0.

Plakophilin-2 is required for transcription of genes that control calcium cycling and cardiac rhythm

Affiliations

Plakophilin-2 is required for transcription of genes that control calcium cycling and cardiac rhythm

Marina Cerrone et al. Nat Commun. .

Abstract

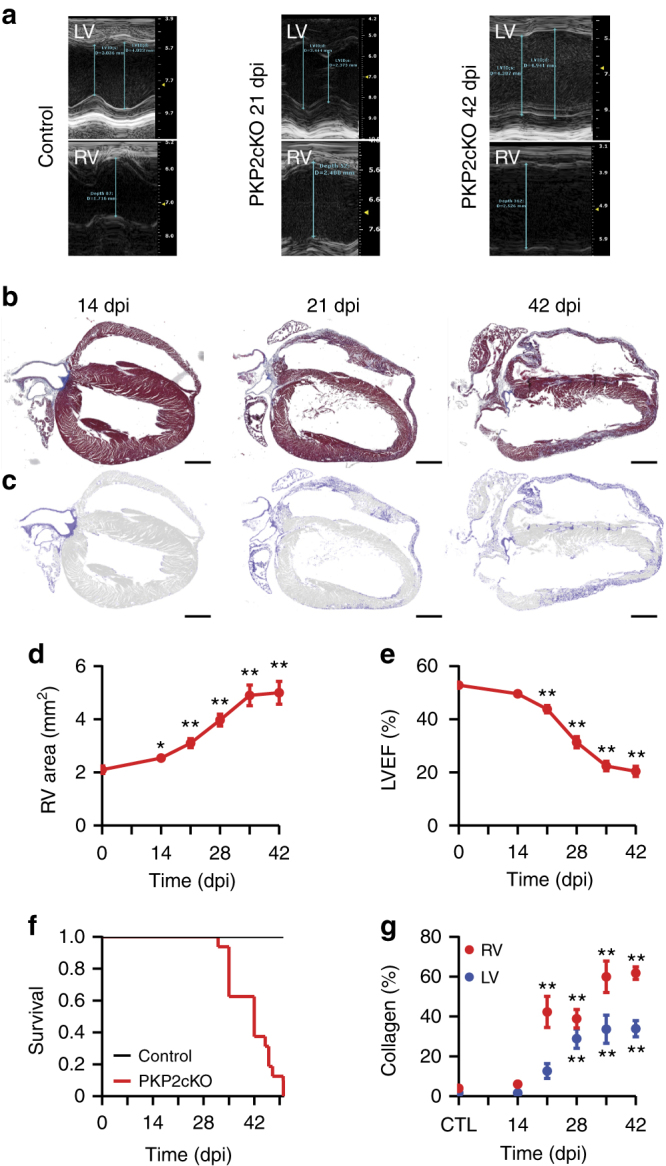
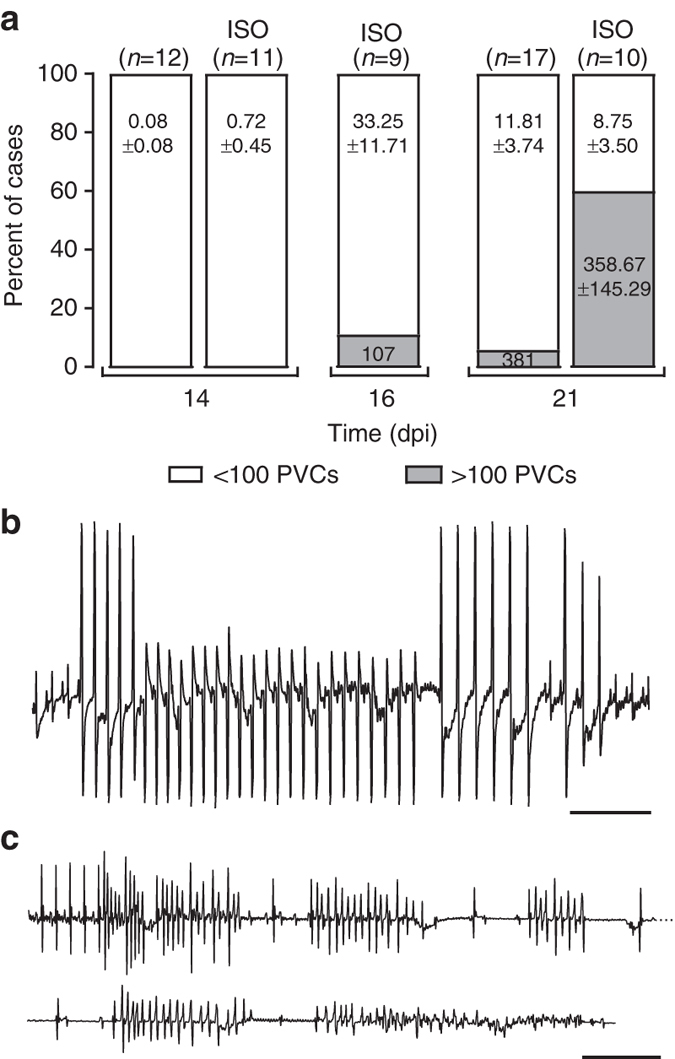
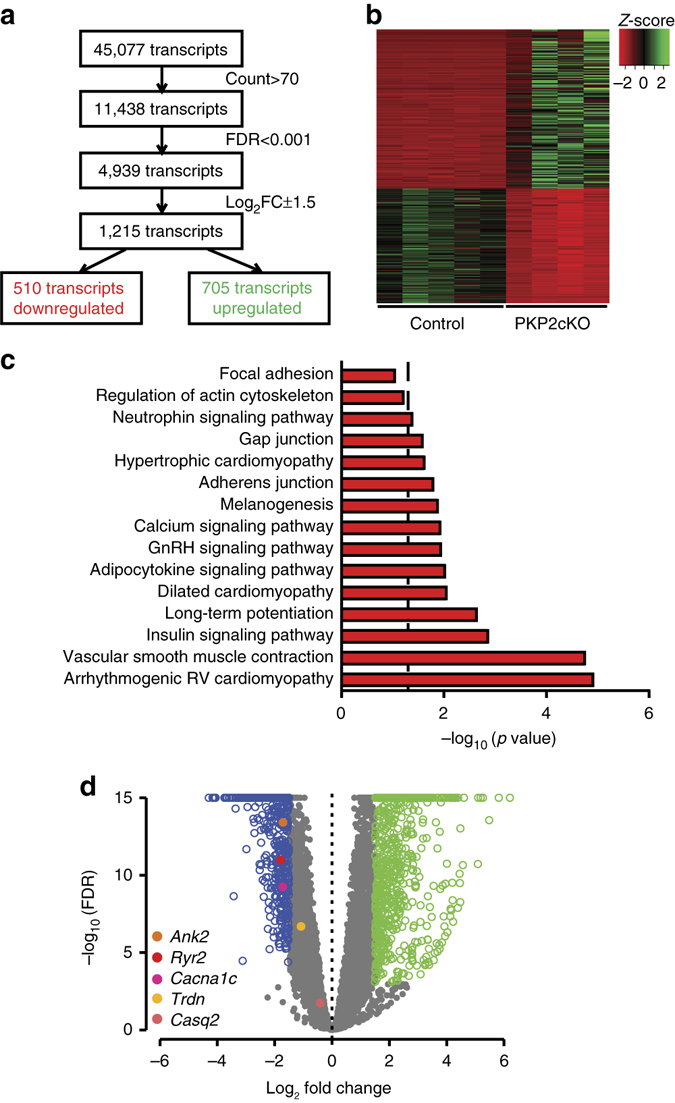
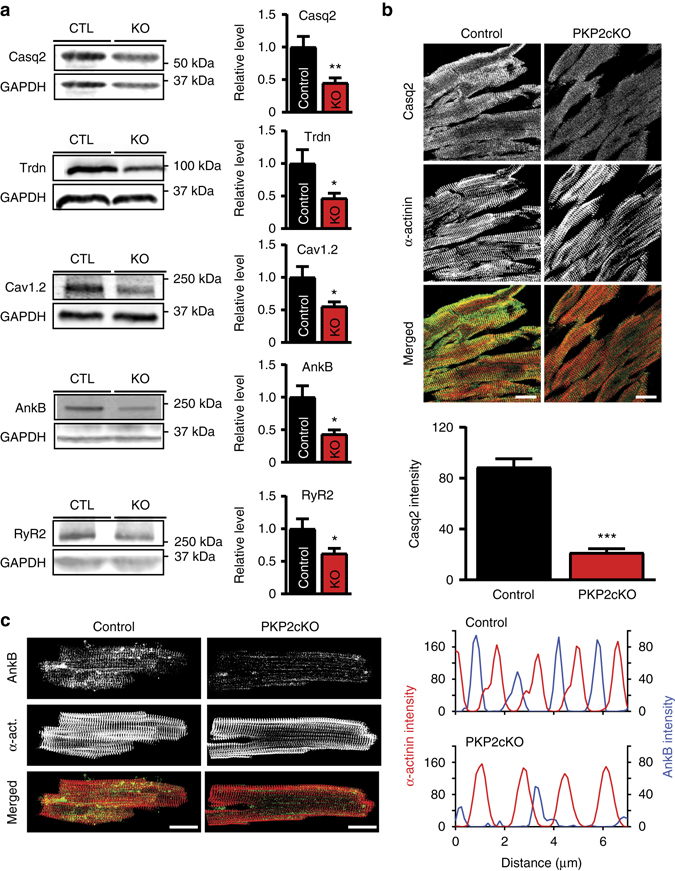
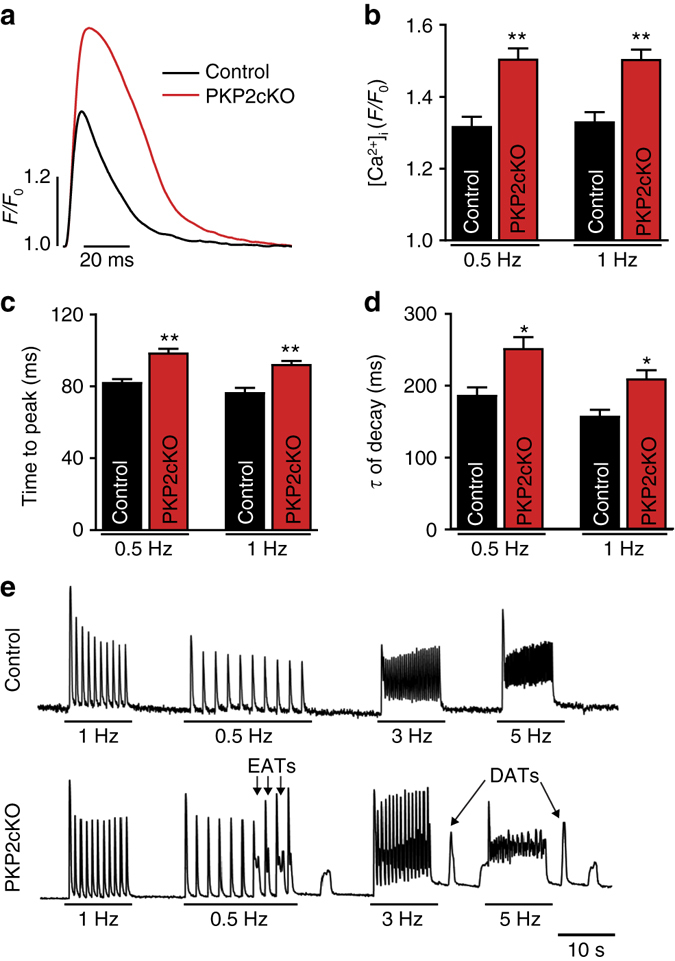
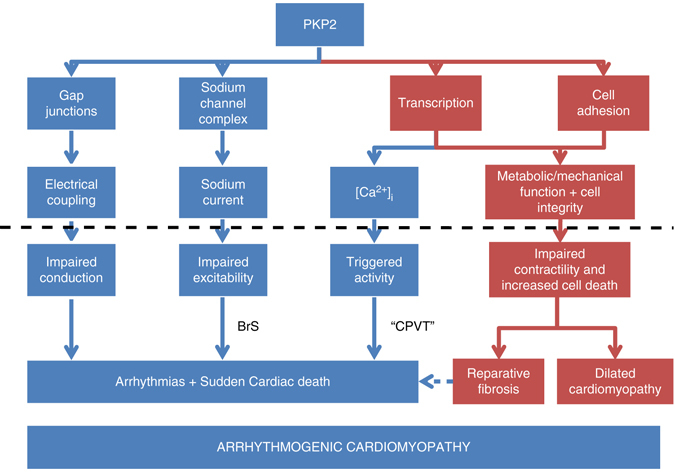
Plakophilin-2 (PKP2) is a component of the desmosome and known for its role in cell-cell adhesion. Mutations in human PKP2 associate with a life-threatening arrhythmogenic cardiomyopathy, often of right ventricular predominance. Here, we use a range of state-of-the-art methods and a cardiomyocyte-specific, tamoxifen-activated, PKP2 knockout mouse to demonstrate that in addition to its role in cell adhesion, PKP2 is necessary to maintain transcription of genes that control intracellular calcium cycling. Lack of PKP2 reduces expression of Ryr2 (coding for Ryanodine Receptor 2), Ank2 (coding for Ankyrin-B), Cacna1c (coding for CaV1.2) and Trdn (coding for triadin), and protein levels of calsequestrin-2 (Casq2). These factors combined lead to disruption of intracellular calcium homeostasis and isoproterenol-induced arrhythmias that are prevented by flecainide treatment. We propose a previously unrecognized arrhythmogenic mechanism related to PKP2 expression and suggest that mutations in PKP2 in humans may cause life-threatening arrhythmias even in the absence of structural disease.It is believed that mutations in desmosomal adhesion complex protein plakophilin 2 (PKP2) cause arrhythmia due to loss of cell-cell communication. Here the authors show that PKP2 controls the expression of proteins involved in calcium cycling in adult mouse hearts, and that lack of PKP2 can cause arrhythmia in a structurally normal heart.


Conflict of interest statement

M.J.A. is a consultant for Boston Scientific, Gilead Sciences, Invitae, Medtronic, MyoKardia, and St. Jude Medical. M.J.A., D.T., and Mayo Clinic have received sales-based royalties from Transgenomic for their FAMILION-LQTS and FAMILION-CPVT genetic tests. M.J.A. and Mayo Clinic have licensed intellectual property to AliveCor. The remaining authors declare no competing financial interests.

Figures

Fig. 1
Fig. 1
Progression of cardiomyopathy in PKP2-cKO mice. a Representative images of M-mode echocardiography recorded from left ventricle and right ventricle (LV; RV) of PKP2-cKO mice before (control; left), 21 dpi (middle) and 42 dpi (right). Notice scales on the right of each panel. b Masson’s trichrome staining of longitudinal heart sections of PKP2-cKO hearts at 14, 21, and 42 dpi (left, middle and right panels, respectively). c High contrast mask of the same sections emphasizing collagen deposition in the RV and LV in blue. Scale bar = 1 mm for all images. d Time course of change in RV area (measured by modified long axis B-mode echocardiography) in PKP2-cKO mice as a function of days after tamoxifen injection (dpi). Number of animals: n = 21 (0 dpi); n = 12 (14 dpi); n = 18 (21 dpi), n = 16 (28 dpi); n = 11 (35 dpi); n = 9 (42 dpi). e LV ejection fraction (LVEF) in PKP2-cKO, measured by long axis B-mode echocardiography. Number of animals: n = 21 (0 dpi), n = 13 (14 dpi), n = 19 (21 dpi), n = 16 (28 dpi), n = 15 (35 dpi), and n = 10 (42 dpi). For d, e, we obtained repeated measures from the same animals; statistical significance was calculated by paired Student’s t-test, comparing each value against its own control. f Kaplan–Meier survival curve of PKP2-cKO and control mice as a function of days after tamoxifen injection. A total of 16 PKP2-cKO and 10 control animals were followed. g Quantification of collagen deposition in the right (RV, red dots) and in the left (LV, blue dots) ventricle of control (CTL, n = 7) and PKP2-cKO hearts at 14 dpi (n = 5), 21 dpi (n = 10), 28 dpi (n = 8), 35 dpi (n = 8) and 42 dpi (n = 9). Statistical significance by one way ANOVA, RV and LV compared independently against corresponding control. For d, e, g: *p < 0.05, **p < 0.001
Fig. 2
Fig. 2
Isoproterenol-induced arrhythmias in PKP2-cKO hearts. a Incidence of spontaneous, and of isoproterenol-induced (ISO) PVCs during 20 min of recording in anesthetized PKP2-cKO mice as a function of days post-tamoxifen injection (dpi). Data reported as percent of total animals studied per time point and condition; number of animals in parenthesis at top of each bar. Numbers inside bars indicate mean ± SEM of ventricular extrasystoles. b Example of ISO-induced non-sustained ventricular tachycardia (NSVT) in a PKP2-cKO mouse. Scale bar = 500 ms. c Example of ISO-induced fatal ventricular tachycardia/fibrillation (VT/VF) in a PKP2-cKO mouse 16 days post tamoxifen injection. Scale bar = 500 ms
Fig. 3
Fig. 3
Transcriptome analysis in PKP2-cKO and control mice. a Flowchart of RNA-Seq analysis. b Heatmap of transcripts from control and PKP2-cKO hearts at 21 dpi (n = 5 and n = 4, respectively) highlighting consistency within groups. Red and green: downregulated and upregulated transcripts, respectively. c Significantly enriched KEGG (Kyoto Encyclopedia Genes and Genomes) categories show differentially downregulated gene pathways in PKP2-cKO hearts. d Volcano plot of upregulated (green) or downregulated (blue) transcripts in PKP2-cKO hearts as per inclusion criteria noted in a. Dots in gray: transcripts meeting exclusion criteria. Dots in other colors: specific transcripts noted in bottom left of plot
Fig. 4
Fig. 4
Remodeling of proteins involved in calcium signaling pathways in the PKP2-cKO mouse. a Representative western blots (left) and average densitometry (right; n = 6 for all groups) measured from control (CTL) and PKP2-cKO (KO) ventricular lysates. *p < 0.05; **p < 0.01 (Student’s t-test). b Immunofluorescence staining for Casq2 (green) and α-actinin (red) in control and PKP2-cKO ventricular sections collected at 21 dpi. Scale bar = 20 µm. Bottom panel: quantification of Casq2 intensity in PKP2-cKO vs. control samples. Analysis from 54 images, obtained from four hearts, both for PKP2cKo and control. ***p < 0.001 vs. control. c Immunofluorescence staining for Ankyrin B (green) and α-actinin (red) in control and PKP2-cKO heart sections at 21 dpi. Scale bar, 20 µm. Right panel: profile expression intensity of AnkB and α-actinin in PKP2-cKO and control hearts
Fig. 5
Fig. 5
Structural changes consequent to PKP2 deletion. a STORM-acquired images of Cav1.2 (green) and RyR2 (purple) in a single myocyte. b Analysis of RyR2/Cav1.2 overlapping area in transverse (left) and longitudinal (right) clusters. n = 1335 and 1285 clusters from 30 control and 25 PKP2-cKO cardiomyocytes at 21 dpi, respectively. t-test, *p < 0.05 and **p < 0.01 vs. control. c 2D-EM image of PKP2-cKO ventricular tissue at 21 dpi showing a dyadic structure. Scale bar = 200 nm. d Boundaries of the jSR (red) and T-tubule (blue) membranes, detected from the dyad in the dotted square in c. e Acquisition of distances from each point in the T-tuble membrane to its closest neighbor in the jSR (green lines). f Close-up of the region inside the dashed square in e. All distances measured within a dyad were averaged to obtain the “average distance” for that dyad (expressed in nm). g Comparison of average data collected from one control (n = 30 dyads) and 2 PKP2-cKO 21 dpi samples (n = 41 dyads for both). Student’s t-test *p < 0.001 vs. control. h Spatial orientation of the T-tubular network, obtained from segmentation and analysis of a volume of 15 × 12 × 0.8 µm3 dimensions obtained by Serial Block-Face Scanning Electron Microscopy analysis. See also Supplementary Video 1 and “Methods”. The angle of the T-tubular skeleton is color-coded (bottom left) from −90° in magenta to +90° in red; relative to the longitudinal axis of the cell (light blue; 0°). i Histogram of orientations (from h), showing a strong preference for zero-degree orientation, as expected from a non-failing heart (see ref. )
Fig. 6
Fig. 6
Calcium current in PKP2-cKO cardiomyocytes at 21 dpi. a L-type calcium current in control (black) and PKP2-cKO (red). b Peak L-type calcium current density as a function of voltage recorded in control (black) and PKP2-cKO (red) cardiomyocytes. Voltage clamp protocol in inset. c Normalized L-type calcium current decay in control (black) and PKP2-cKO (red) cardiomyocytes. Inset: Tau of inactivation of the L-type calcium current in control (black) and PKP2-cKO (red) cardiomyocytes. Student’s t-test, *p < 0.05 vs. control. d L-type calcium current decay in control (black) and PKP2-cKO (red) cardiomyocytes. Inset: Charge (Q) passing through calcium channels during L-type calcium current in control (black) and PKP2cKO (red) cardiomyocytes. For b, c and d, results collected from 13 cells, three mice in the control group and 10 cells, three mice in the PKP2-cKO group. e Example of SICM recording showing crest and T-tubules. f Occurrence ratio of calcium channels at crest and T-tubules measured by SICM in control (n = 11 and 18 for crest and T-tubules respectively; black) and PKP2-cKO (n = 15 and 22 for crest and T-tubules respectively; red) cardiomyocytes. Five mice in each group. χ 2 test, *p < 0.05 vs. control. g Calcium channel unitary conductance in control (n = 5; black) and PKP2-cKO (n = 5; red) cardiomyocytes. Five mice in each group
Fig. 7
Fig. 7
Dysruption of [Ca2+]i homeostasis in PKP2-cKO cardiomyocytes at 21 dpi. a Laser scanning confocal image of Ca2+ in control (top) and PKP2-cKO (bottom) permeabilized cardiomyocytes. b Sarcoplasmic reticulum (SR) Ca2+ leak in control (n = 30 cells from three hearts, black) and PKP2-cKO cardiomyocytes (n = 23 cells from three hearts, red). Statistical difference was estimated by measuring the average of spontaneous Ca2+ release without any stimulation. **p < 0.01 vs. control. c SR Ca2+ load estimated by measuring the peak of caffeine-induced Ca2+ release from control (n = 30 cells from three hearts, black) and PKP2-cKO permeabilized cardiomyocytes (n = 23 cells from three hearts, red) relative to the fluorescence intensity at baseline (F 0). Given that cells were permeabilized, F 0 was the same for control and for PKP2-cKO. *p < 0.05 vs. control. d Ratio between Ca2+ leak and SR Ca2+ load in permeabilized cells, **p < 0.01 vs. control. e Peak of caffeine-induced Ca2+ release (F) in control (n = 33 cells from three hearts, black) and PKP2-cKO intact cardiomyocytes (n = 34 cells from three hearts, red) relative to fluorescence at baseline (F baseline). f Diastolic [Ca2+]i in control (n = 10 cells from three hearts) and PKP2-cKO (n = 10 cells from three hearts) cardiomyocytes. Student’s t-test *p < 0.05. This result indicates that F at baseline (F baseline) for the data in e was not the same for the two groups. The combined data in e and f indicate an increase in SR load in intact cells. g Representative confocal line-scan images of Ca2+ sparks recorded in control and PKP2-cKO cardiomyocytes. h, i Bar graphs depicting Ca2+ spark amplitude (F/F 0) and Ca2+ spark frequency, respectively, measured as the number of events per unit time and length in control (n = 200 sparks, N = 27 cells from three hearts, black) and PKP2-cKO intact cardiomyocytes (n = 457 sparks, N = 30 cells from four hearts, red). Student’s t-test, ***p < 0.001 vs. control
Fig. 8
Fig. 8
Excitation–contraction (e–c) coupling gain. a Representative examples of excitation–contraction coupling gain measurement in WT (left) and KO (right) cells. Cells were voltage-clamped at −50 mV, and depolarized from −40 mV to +60 mV for 300 ms in 10 mV increments. Red traces in top panels correspond to the current triggered by the 0 mV voltage pulse (top). Ca2+ transients were recorded simultaneously with L-type Ca2+ currents (middle). Fluorescence intensities were plotted from the Ca2+ images (bottom). b Amplitude of Ca2+ i transients in control and PKP2-cKO cardiomyocytes. c e–c coupling gain, calculated as the ratio of [Ca2+]i transient amplitude (ΔF/F 0) vs. I CaL density (pA/pF), was significantly higher for PKP2-cKO cardiomyocytes, especially at positive test potentials. (Control: n = 10 from two mice; PKP2-cKO: n = 11 from three mice; *p < 0.05 vs. control by Student’s t-test)
Fig. 9
Fig. 9
Ca2+ transients in PKP2-cKO cardiomyocytes at 21 dpi. a Ca2+ transients from control (black) and PKP2-cKO (red) cardiomyocytes paced at 1 Hz. bd Quantification of time to peak (b), amplitude (c) and relaxation time constant (d) of calcium transients from ventricular myocytes paced at 0.5 and 1 Hz from control (n = 26; three mice) and PKP2-cKO (n = 50; three mice) cardiomyocytes. Student’s t-test, *p < 0.05, **p < 0.01 vs. control. e Examples of Ca2+transients in control (top) and PKP2-cKO cardiomyocytes (bottom) with different pacing rates (0.5–1–3–5 Hz). Both early after-transients (EATs) and delayed after-transients (DATs) were recorded
Fig. 10
Fig. 10
Diagrammatic representation of the function of PKP2 in the adult heart. PKP2 scaffolds a signaling node at the intercalated disc. From that position, it covers four known functions: Maintains intercellular coupling and sodium channel function, modulates transcription, and facilitates cell–cell adhesion. In the present study, we show that transcriptional regulation impacts on [Ca2+]i homeostasis. These functions are necessary for normal electrical and mechanical function. Loss or mutations in PKP2 (signaled by the black horizontal dotted line) could independently impair electrical (blue) or mechanical (red) function. A predominant effect in one of these descending branches would yield either an electrical phenotype (resembling Brugada syndrome—BrS—or resembling catecholaminergic polymorphic ventricular tachycardia—CPVT), a mechanical phenotype (e.g., dilated cardiomyopathy) or a combination of both, which would yield the “classic” phenotype of ARVC

References

    1. Corrado D, Link MS, Calkins H. Arrhythmogenic right ventricular cardiomyopathy. N. Engl. J. Med. 2017;376:61–72. doi: 10.1056/NEJMra1509267. - DOI - PubMed
    1. Philips B, Cheng A. 2015 update on the diagnosis and management of arrhythmogenic right ventricular cardiomyopathy. Curr. Opin. Cardiol. 2016;31:46–56. doi: 10.1097/HCO.0000000000000240. - DOI - PubMed
    1. Groeneweg JA, et al. Clinical presentation, long-term follow-up, and outcomes of 1001 arrhythmogenic right ventricular dysplasia/cardiomyopathy patients and family members. Circ. Cardiovasc. Genet. 2015;8:437–46. doi: 10.1161/CIRCGENETICS.114.001003. - DOI - PubMed
    1. Basso C, Corrado D, Marcus FI, Nava A, Thiene G. Arrhythmogenic right ventricular cardiomyopathy. Lancet. 2009;373:1289–300. doi: 10.1016/S0140-6736(09)60256-7. - DOI - PubMed
    1. Delmar M, McKenna WJ. The cardiac desmosome and arrhythmogenic cardiomyopathies: from gene to disease. Circ. Res. 2010;107:700–14. doi: 10.1161/CIRCRESAHA.110.223412. - DOI - PubMed

Publication types

MeSH terms