

Bridging the gap between measurements and modelling: a cardiovascular functional avatar
- PMID: 28740184
- PMCID: PMC5524911
- DOI: 10.1038/s41598-017-06339-0
Bridging the gap between measurements and modelling: a cardiovascular functional avatar
Erratum in
-
Publisher Correction: Bridging the gap between measurements and modelling: a cardiovascular functional avatar.Sci Rep. 2020 Jan 29;10(1):1717. doi: 10.1038/s41598-020-58809-7. Sci Rep. 2020. PMID: 31996774 Free PMC article.
Abstract
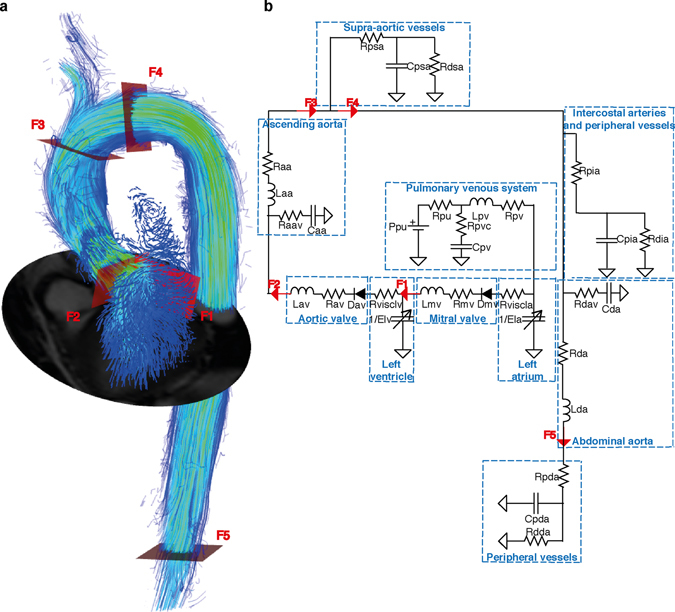
Lumped parameter models of the cardiovascular system have the potential to assist researchers and clinicians to better understand cardiovascular function. The value of such models increases when they are subject specific. However, most approaches to personalize lumped parameter models have thus far required invasive measurements or fall short of being subject specific due to a lack of the necessary clinical data. Here, we propose an approach to personalize parameters in a model of the heart and the systemic circulation using exclusively non-invasive measurements. The personalized model is created using flow data from four-dimensional magnetic resonance imaging and cuff pressure measurements in the brachial artery. We term this personalized model the cardiovascular avatar. In our proof-of-concept study, we evaluated the capability of the avatar to reproduce pressures and flows in a group of eight healthy subjects. Both quantitatively and qualitatively, the model-based results agreed well with the pressure and flow measurements obtained in vivo for each subject. This non-invasive and personalized approach can synthesize medical data into clinically relevant indicators of cardiovascular function, and estimate hemodynamic variables that cannot be assessed directly from clinical measurements.
Conflict of interest statement
The authors declare that they have no competing interests.
Figures


References
-
- Frank O. Die Grundform des Arteriellen Pulses. Z Biol-Munich. 1899;37:483–526.
-
- Guyton AC, Coleman TGA, Granger HJ. Circulation: Overall Regulation. Annu Rev Physiol. 1972;34:13–44. - PubMed
-
- Spilker RL, Taylor CA. Tuning Multidomain Hemodynamic Simulations to Match Physiological Measurements. Ann Biomed Eng. 2010;38:2635–2648. - PubMed
Publication types
MeSH terms
Grants and funding
LinkOut - more resources
Full Text Sources
Other Literature Sources
Medical
Miscellaneous
