. 2017 Jul 24;7(1):6285.
doi: 10.1038/s41598-017-06731-w.

The Role of Inflammation in β-cell Dedifferentiation

Affiliations

The Role of Inflammation in β-cell Dedifferentiation

Thierry M Nordmann et al. Sci Rep. .

Abstract

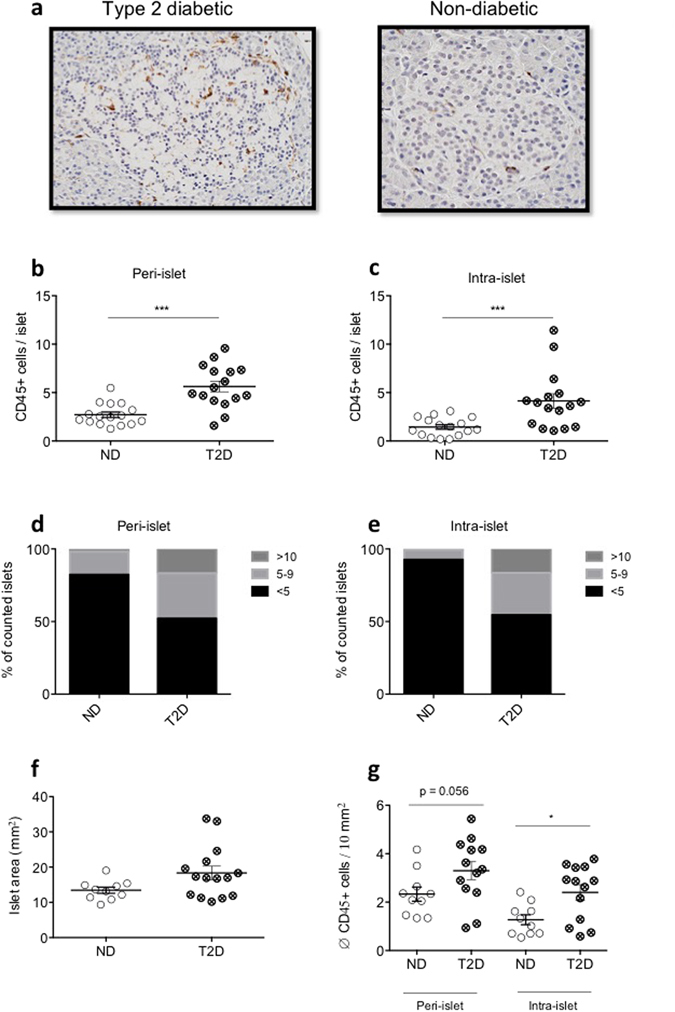
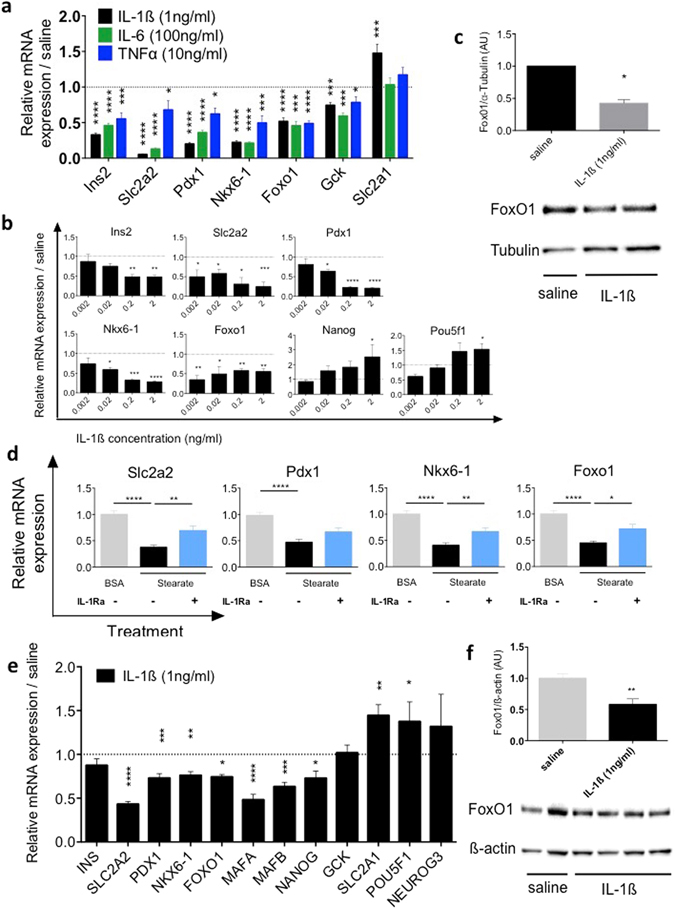
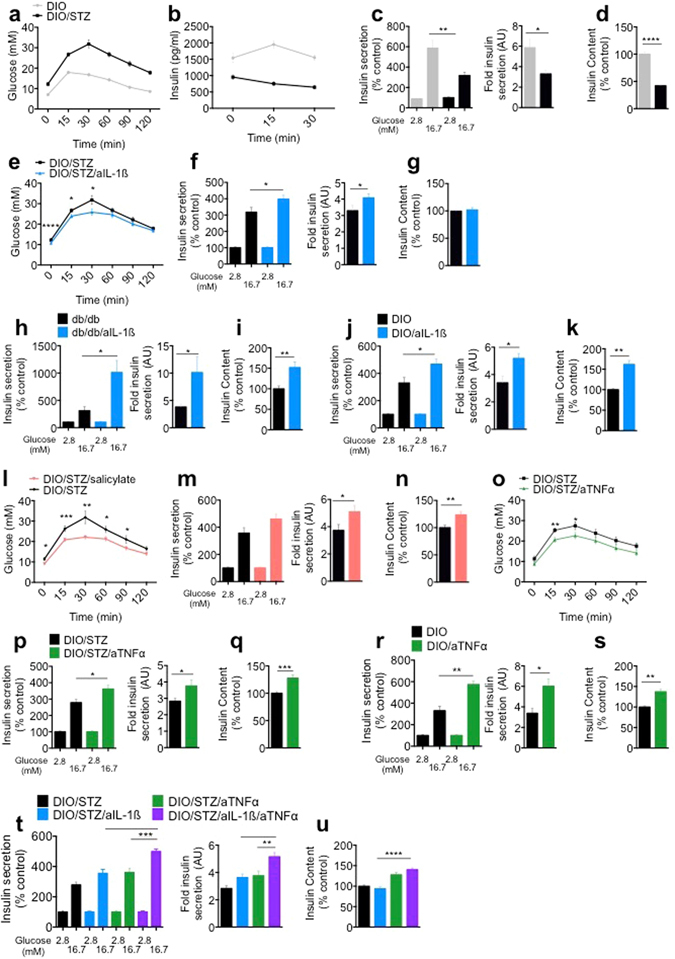
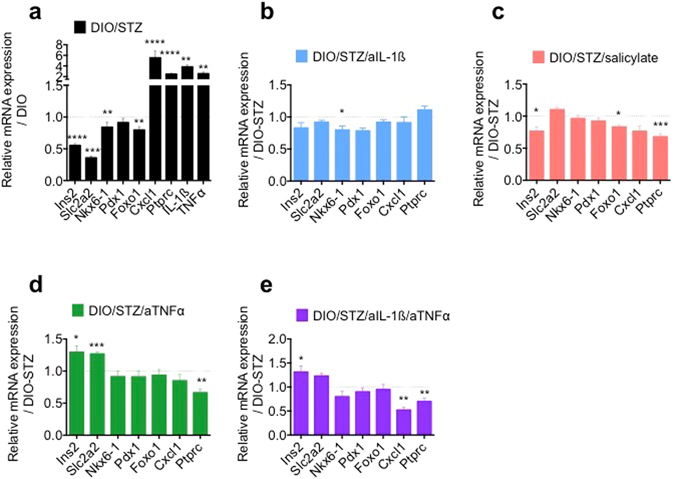
Chronic inflammation impairs insulin secretion and sensitivity. β-cell dedifferentiation has recently been proposed as a mechanism underlying β-cell failure in T2D. Yet the effect of inflammation on β-cell identity in T2D has not been studied. Therefore, we investigated whether pro-inflammatory cytokines induce β-cell dedifferentiation and whether anti-inflammatory treatments improve insulin secretion via β-cell redifferentiation. We observed that IL-1β, IL-6 and TNFα promote β-cell dedifferentiation in cultured human and mouse islets, with IL-1β being the most potent one of them. In particular, β-cell identity maintaining transcription factor Foxo1 was downregulated upon IL-1β exposure. In vivo, anti-IL-1β, anti-TNFα or NF-kB inhibiting sodium salicylate treatment improved insulin secretion of isolated islets. However, only TNFα antagonism partially prevented the loss of β-cell identity gene expression. Finally, the combination of IL-1β and TNFα antagonism improved insulin secretion of ex vivo isolated islets in a synergistic manner. Thus, while inflammation triggered β-cell dedifferentiation and dysfunction in vitro, this mechanism seems to be only partly responsible for the observed in vivo improvements in insulin secretion.


Conflict of interest statement

The authors declare that they have no competing interests.

Figures

Figure 1
Figure 1
Pancreatic islets of patients with type 2 diabetes contain more CD45 + immune cells than islets of non-diabetic subjects. (a) Representative islet histology of type 2 diabetic (T2D) and non-diabetic (ND) subjects. Peri-islet and intra-islet CD45 + immune cell count (b and c, respectively) and distribution (d and e, respectively) in human pancreatic tissue sections of T2D and ND control subjects. Islet area (f) and islet-area-corrected average CD45 + immune cell count (g) in T2D and ND control subjects. (be) n = 17, 16 for T2D and ND subjects, respectively, (f,g) n = 14, 10 for T2D and ND subjects. n = 30–35 islets/subject were counted. ***P < 0.001. Statistical significance (P) was determined using the two-tailed Mann-Whitney U test. All error bars denote s.e.m.
Figure 2
Figure 2
Cytokine induced β-cell dedifferentiation. (a) mRNA expression levels of Insulin (Ins2), GLUT2 (Slc2a2), Pdx1 and Nkx6-1, Foxo1, glucokinase (Gck) and GLUT1 (Slc2a1) in mouse islets after 24 hours of treatment with 1ng/ml of IL-1β, 100ng/ml of IL-6 and 10 ng/ml of TNFα relative to solvent (dashed line). (b) mRNA expression levels in mouse islets after 24 hours of exposure to various concentrations of IL-1β relative to solvent (dashed line). (c) Protein quantification and a representative Western blot of FoxO1 in mouse islets after 24 hours treatment with IL-1β (1 ng/ml) or saline. (d) mRNA expression levels in mouse islets after 24 hours treatment with 0.25 mM of stearate in the absence (black bars) or presence of the IL-1 receptor antagonist IL-1Ra (1 μg/ml; blue bars) compared to solvent (BSA). (e) mRNA expression levels in human islets after 24 hours of IL-1β (1 ng/ml) treatment relative to solvent (dashed line). (f) Protein quantification and a representative Western blot of FoxO1 in human islets after 24 hours of IL-1β (1 ng/ml). (a) n = 12. (b) n = 9. (c) n = 3–5. (d) n = 14–16. (e) n = 9–10. (f) n = 6–8. All sample sizes represent the sum of 3 independent experiments. *P < 0.05, **P < 0.01, ***P < 0.001, ****P < 0.0001 of treatment group vs. untreated control. Statistical significance (P) was determined using the two-tailed Mann-Whitney U (Fig. a,c–f) and one-way ANOVA (Fig. b). All error bars denote s.e.m.
Figure 3
Figure 3
In vivo anti-inflammatory treatment ameliorates diabetic phenotype and improves β-cell insulin secretion capacity. (a) Glucose levels and (b) corresponding insulin levels following an ipGTT in DIO and DIO/STZ mice. (c,d) GSIS, corresponding fold insulin secretion and insulin content of isolated islets from DIO and DIO/STZ mice. (e) Glucose levels following an ipGTT in DIO/STZ mice ± anti-IL-1β (aIL-1β). (f,g) GSIS, corresponding fold insulin secretion and insulin content of isolated islets from DIO/STZ mice ± aIL-1β. (hk) GSIS, corresponding fold insulin secretion and insulin content of isolated islets from (h,i) db/db mice ± aIL-1β treatment for 2 weeks and (j,k) DIO mice ± aIL-1β treatment for 8 weeks. (l) Glucose levels following an ipGTT in DIO/STZ mice ± sodium salicylate. (m,n) GSIS, corresponding fold insulin secretion and insulin content of isolated islets from DIO/STZ mice ± sodium salicylate treatment. (o) Glucose levels following an ipGTT in DIO/STZ mice ± anti TNFα (aTNFα) treatment. (p,q) GSIS, corresponding fold insulin secretion and insulin content of isolated islets from DIO/STZ mice ± aTNFα treatment. (r,s) GSIS and corresponding fold insulin secretion of isolated islets from DIO mice ± aTNFα treatment for 8 weeks. (t,u) GSIS, corresponding fold insulin secretion and insulin content from DIO/STZ mice ± aTNFα/aIL-1β treatment. (a,b) n = 19 each, 3 experiments. (c,d) n = 18 each, 3 experiments. (e) n = 19 each, 3 experiments. (f,g) n = 18 each, 3 experiments. (h,i) n = 6 each, 1 experiment. (j,k) n = 5 each, 1 experiment. (l) n = 14 each, 2 experiments. (m,n) n = 12 each, 2 experiments. (o) n = 11 each, 2 experiments. (p,q) n = 12 each, 2 experiments. (r,s) n = 6 each, 1 experiment. (t,u) n = 12 each, 2 experiments. n represents the number of mice in in vivo experiments and biological replicates in experiments with isolated islets. *P < 0.05, **P < 0.01, ***P < 0.001, ****P < 0.0001. Statistical significance (P) was determined using the two-tailed Mann-Whitney U (Fig. a-s) and one-way ANOVA (Fig. t,u). All error bars denote s.e.m. DIO, diet-induced obese; DIO/STZ, diet-induced obese/streptozotocin; ipGTT, intraperitoneal glucose-tolerance test.
Figure 4
Figure 4
Impact of in vivo anti-inflammatory treatment on β-cell dedifferentiation. (a) Relative mRNA expression levels of isolated islets of DIO/STZ compared to DIO mice. (b) Relative mRNA expression levels of isolated islets from DIO/STZ mice ± aIL-1β treatment. (c) Relative mRNA expression levels of isolated islets from DIO/STZ mice ± salicylate treatment. (d) Relative mRNA expression levels of isolated islets from DIO/STZ mice ± aTNFα treatment. (e) Relative mRNA expression levels of isolated islets from DIO/STZ mice ± aTNFα/aIL-1β treatment. (a) n = 20 (DIO/STZ), 29 (DIO), 3 experiments, except for IL-1β and TNFα n = 5. (b) 18–20 each, 3 experiments. (c) n = 15–16 each, 2 experiments. (d) n = 7–10, 2 experiments. (e) n = 7–9, 2 experiments. *P < 0.05, **P < 0.01, ***P < 0.001, ****P < 0.0001. Statistical significance (P) was determined using the two-tailed Mann-Whitney U test. All error bars denote s.e.m. DIO, diet-induced obese; DIO/STZ, diet-induced obese/streptozotocin.

References

    1. Tabak AG, et al. Trajectories of glycaemia, insulin sensitivity, and insulin secretion before diagnosis of type 2 diabetes: an analysis from the Whitehall II study. Lancet. 2009;373:2215–2221. doi: 10.1016/S0140-6736(09)60619-X. - DOI - PMC - PubMed
    1. Boni-Schnetzler M, et al. Free fatty acids induce a proinflammatory response in islets via the abundantly expressed interleukin-1 receptor I. Endocrinology. 2009;150:5218–5229. doi: 10.1210/en.2009-0543. - DOI - PubMed
    1. Back SH, Kaufman RJ. Endoplasmic reticulum stress and type 2 diabetes. Annu Rev Biochem. 2012;81:767–793. doi: 10.1146/annurev-biochem-072909-095555. - DOI - PMC - PubMed
    1. Masters SL, et al. Activation of the NLRP3 inflammasome by islet amyloid polypeptide provides a mechanism for enhanced IL-1beta in type 2 diabetes. Nat Immunol. 2010;11:897–904. doi: 10.1038/ni.1935. - DOI - PMC - PubMed
    1. Westwell-Roper CY, Ehses JA, Verchere CB. Resident macrophages mediate islet amyloid polypeptide-induced islet IL-1beta production and beta-cell dysfunction. Diabetes. 2014;63:1698–1711. doi: 10.2337/db13-0863. - DOI - PubMed

Publication types

MeSH terms