

Richer gut microbiota with distinct metabolic profile in HIV infected Elite Controllers
- PMID: 28740260
- PMCID: PMC5524949
- DOI: 10.1038/s41598-017-06675-1
Richer gut microbiota with distinct metabolic profile in HIV infected Elite Controllers
Abstract
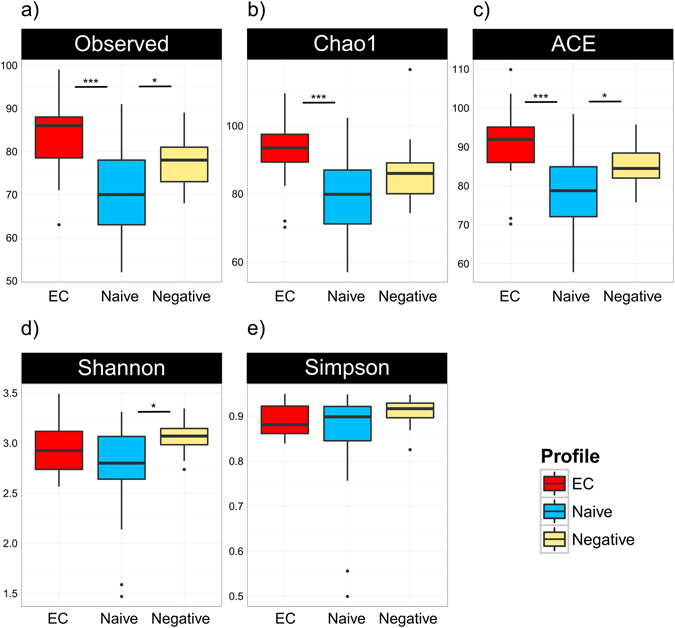
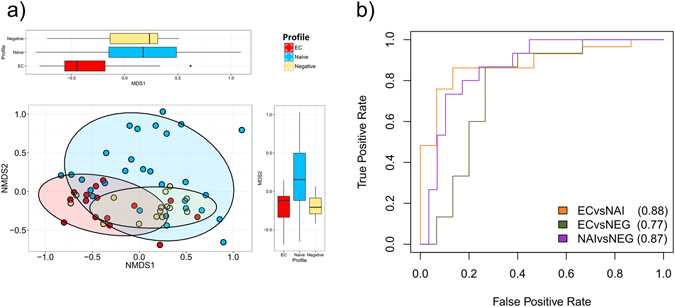
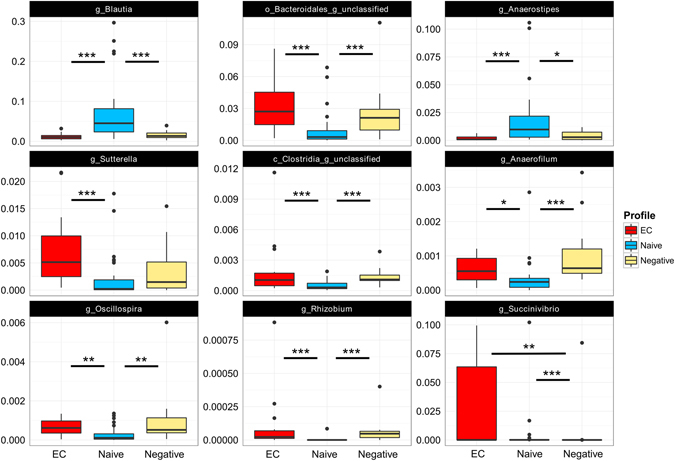
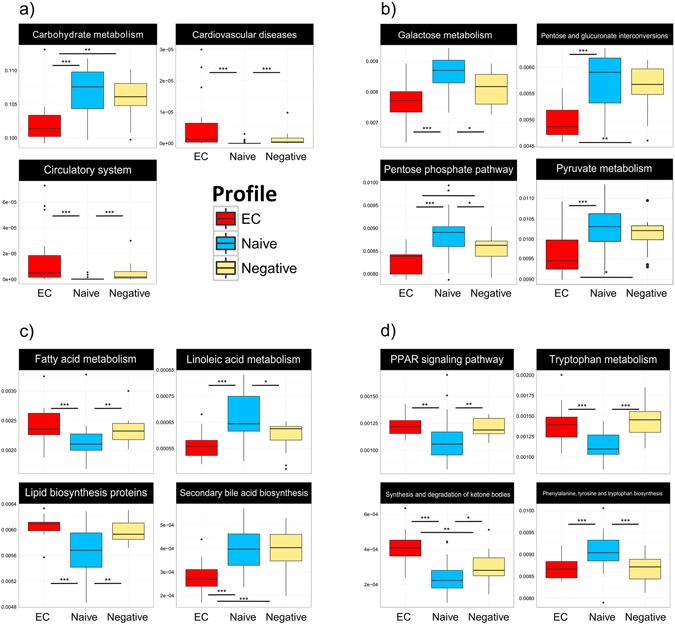
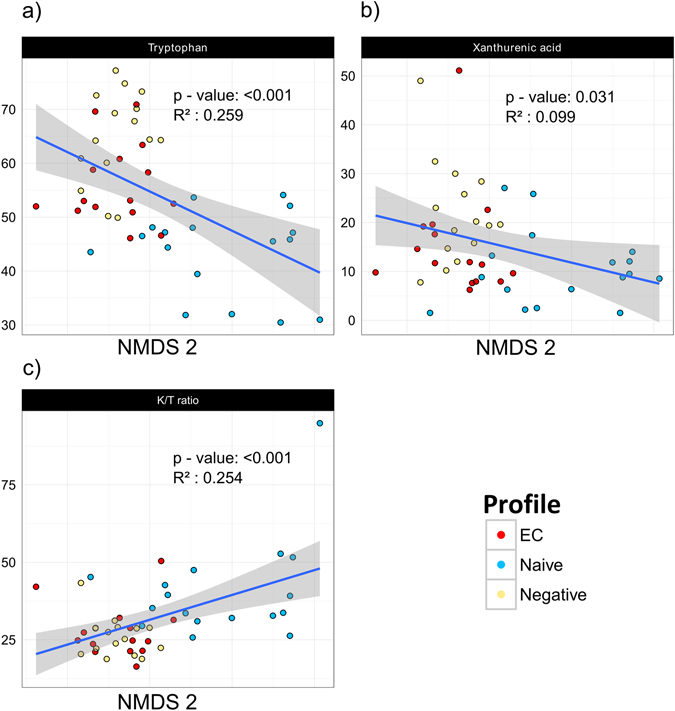
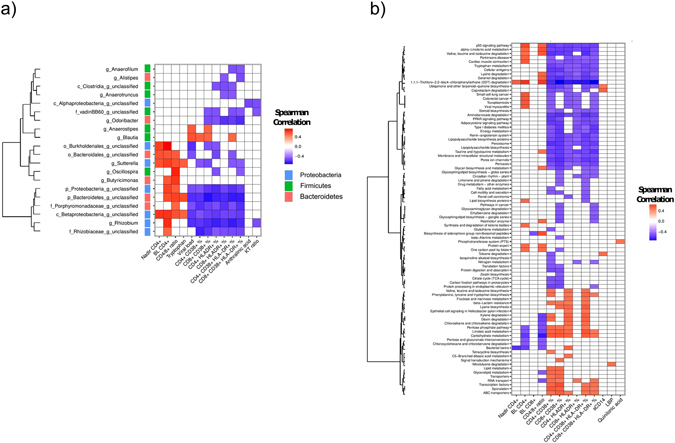
Gut microbiota dysbiosis features progressive HIV infection and is a potential target for intervention. Herein, we explored the microbiome of 16 elite controllers (EC), 32 antiretroviral therapy naive progressors and 16 HIV negative controls. We found that the number of observed genera and richness indices in fecal microbiota were significantly higher in EC versus naive. Genera Succinivibrio, Sutterella, Rhizobium, Delftia, Anaerofilum and Oscillospira were more abundant in EC, whereas Blautia and Anaerostipes were depleted. Additionally, carbohydrate metabolism and secondary bile acid synthesis pathway related genes were less represented in EC. Conversely, fatty acid metabolism, PPAR-signalling and lipid biosynthesis proteins pathways were enriched in EC vs naive. The kynurenine pathway of tryptophan metabolism was altered during progressive HIV infection, and inversely associated with microbiota richness. In conclusion, EC have richer gut microbiota than untreated HIV patients, with unique bacterial signatures and a distinct metabolic profile which may contribute to control of HIV.
Conflict of interest statement
The authors declare that they have no competing interests.
Figures
Similar articles
-
Gut Microbiome Profiles and Associated Metabolic Pathways in HIV-Infected Treatment-Naïve Patients.Cells. 2021 Feb 13;10(2):385. doi: 10.3390/cells10020385. Cells. 2021. PMID: 33668457 Free PMC article.
-
Dysbiosis of the gut microbiota is associated with HIV disease progression and tryptophan catabolism.Sci Transl Med. 2013 Jul 10;5(193):193ra91. doi: 10.1126/scitranslmed.3006438. Sci Transl Med. 2013. PMID: 23843452 Free PMC article.
-
Fecal Metabolome Signature in the HIV-1 Elite Control Phenotype: Enrichment of Dipeptides Acts as an HIV-1 Antagonist but a Prevotella Agonist.J Virol. 2021 Aug 25;95(18):e0047921. doi: 10.1128/JVI.00479-21. Epub 2021 Aug 25. J Virol. 2021. PMID: 34232744 Free PMC article.
-
Complexities of Gut Microbiome Dysbiosis in the Context of HIV Infection and Antiretroviral Therapy.Clin Pharmacol Ther. 2016 Jun;99(6):600-11. doi: 10.1002/cpt.363. Epub 2016 Apr 16. Clin Pharmacol Ther. 2016. PMID: 26940481 Free PMC article. Review.
-
The microbiome and HIV persistence: implications for viral remission and cure.Curr Opin HIV AIDS. 2018 Jan;13(1):61-68. doi: 10.1097/COH.0000000000000434. Curr Opin HIV AIDS. 2018. PMID: 29135490 Free PMC article. Review.
Cited by
-
Gut microbiome dysbiosis in men who have sex with men increases HIV infection risk through immunity homeostasis alteration.Front Cell Infect Microbiol. 2023 Nov 16;13:1260068. doi: 10.3389/fcimb.2023.1260068. eCollection 2023. Front Cell Infect Microbiol. 2023. PMID: 38035339 Free PMC article.
-
Single-Cell Sequencing Facilitates Elucidation of HIV Immunopathogenesis: A Review of Current Literature.Front Immunol. 2022 Feb 3;13:828860. doi: 10.3389/fimmu.2022.828860. eCollection 2022. Front Immunol. 2022. PMID: 35185920 Free PMC article. Review.
-
The Impact of Human Immunodeficiency Virus Infection on Gut Microbiota α-Diversity: An Individual-level Meta-analysis.Clin Infect Dis. 2020 Feb 3;70(4):615-627. doi: 10.1093/cid/ciz258. Clin Infect Dis. 2020. PMID: 30921452 Free PMC article.
-
A specific structure and high richness characterize intestinal microbiota of HIV-exposed seronegative individuals.PLoS One. 2021 Dec 2;16(12):e0260729. doi: 10.1371/journal.pone.0260729. eCollection 2021. PLoS One. 2021. PMID: 34855852 Free PMC article.
-
Enriched Opportunistic Pathogens Revealed by Metagenomic Sequencing Hint Potential Linkages between Pharyngeal Microbiota and COVID-19.Virol Sin. 2021 Oct;36(5):924-933. doi: 10.1007/s12250-021-00391-x. Epub 2021 May 12. Virol Sin. 2021. PMID: 33978940 Free PMC article.
References
Publication types
MeSH terms
Substances
LinkOut - more resources
Full Text Sources
Other Literature Sources
Medical
