Comparative Study
. 2018 Jan;38(1):144-154.
doi: 10.1111/liv.13529. Epub 2017 Aug 19.

Telomerase enzyme deficiency promotes metabolic dysfunction in murine hepatocytes upon dietary stress

Affiliations
Comparative Study

Telomerase enzyme deficiency promotes metabolic dysfunction in murine hepatocytes upon dietary stress

Raquel M Alves-Paiva et al. Liver Int. 2018 Jan.

Abstract

Background & aims: Short telomeres and genetic telomerase defects are risk factors for some human liver diseases, ranging from non-alcoholic fatty liver disease and non-alcoholic steatohepatitis to cirrhosis. In murine models, telomere dysfunction has been shown to metabolically compromise hematopoietic cells, liver and heart via the activation of the p53-PGC axis.

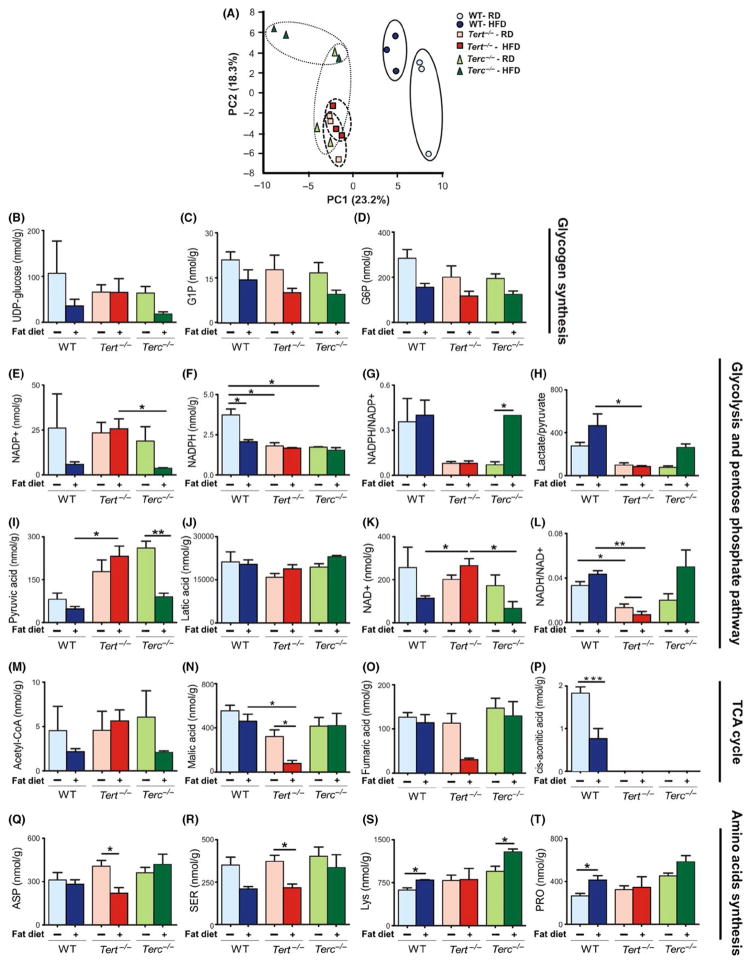
Methods: Tert- and Terc-deficient mice were challenged with liquid high-fat diet. Liver metabolic contents were analysed by CE-TOFMS and liver fat content was confirmed by confocal and electronic microscopy.

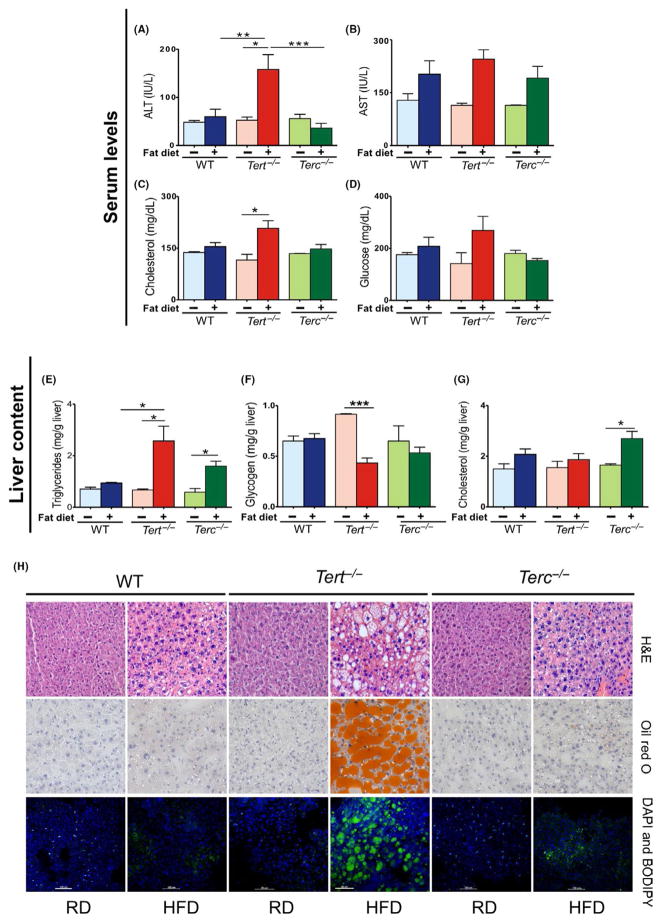
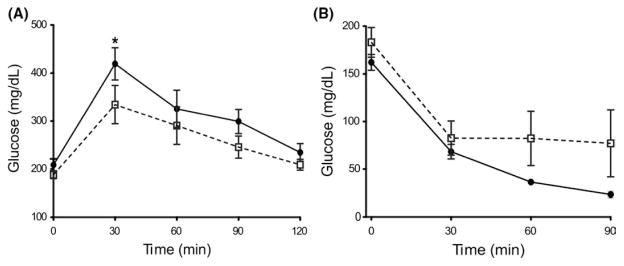
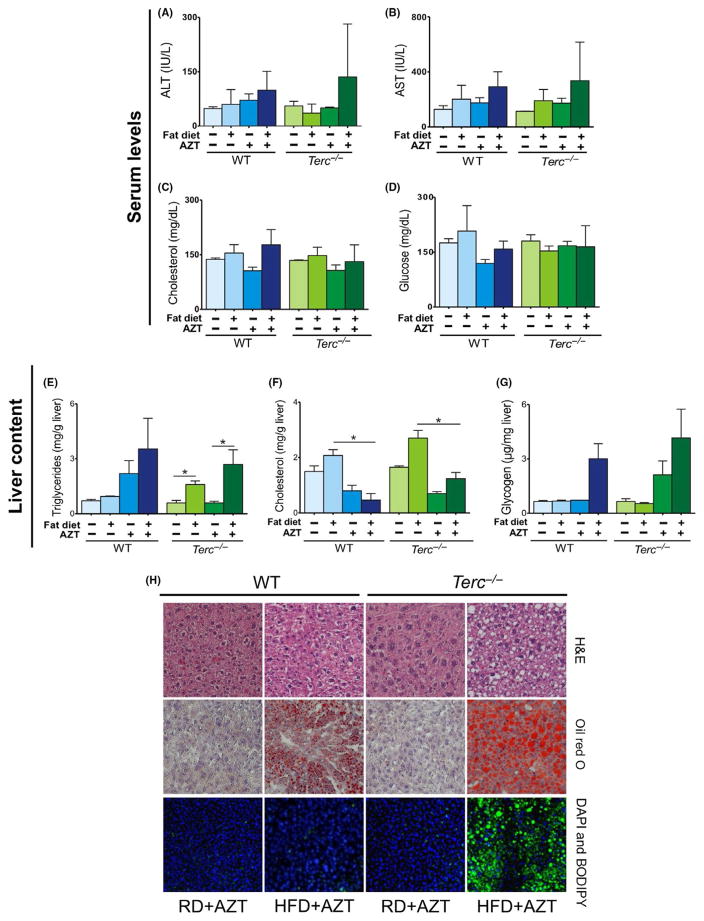
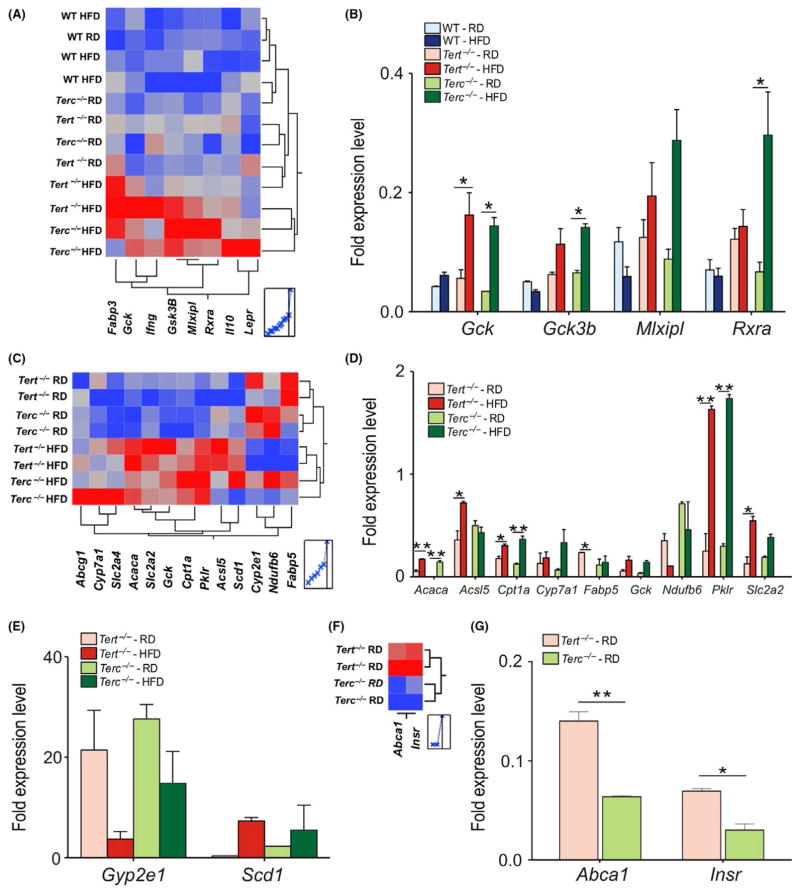
Results: Tert-deficient but not Terc-deficient mice develop hepatocyte injury and frank steatosis when challenged with liquid high-fat diet. Upon high-fat diet, Tert-/- hepatocytes fail to engage the citric acid cycle (TCA), with an imbalance of NADPH/NADP+ and NADH/NAD+ ratios and depletion of intermediates of TCA cycle, such as cis-aconitic acid. Telomerase deficiency caused an intrinsic metabolic defect unresponsive to environmental challenge. Chemical inhibition of telomerase by zidovudine recapitulated the abnormal Tert-/- metabolic phenotype in Terc-/- hepatocytes.

Conclusions: Our findings indicate that in telomeropathies short telomeres are not the only molecular trigger and telomerase enzyme deficiency provokes hepatocyte metabolic dysfunction, abrogates response to environmental challenge, and causes cellular injury and steatosis, providing a mechanism for liver damage in telomere diseases.

Keywords: fatty liver; high-fat diet; metabolic dysfunction; telomerase-deficient liver.


Conflict of interest statement

CONFLICT OF INTEREST

The authors do not have any disclosures to report.

Figures

FIGURE 1
FIGURE 1
Effects of 15-d HFD in Tert−/−, Terc−/− and WT male mice. Murine serum levels were quantified under RD and HFD conditions: (A) ALT (IU/L), (B) AST(IU/L), (C) cholesterol (mg/dL), (D) glucose (mg/dL) and murine liver content (mg/g of liver) were quantified under RD and HFD conditions: (E) triglycerides, (F) glycogen and (G) cholesterol. (H) Representative microscopy images of WT, Tert−/− and Terc−/− mouse liver sections: H&E or oil red O staining (light microscopy); and DAPI and BODIPY staining (confocal microscopy). Error bars indicate mean ±SEM. *P < .05 for the samples compared with RD conditions by Student’s one-tailed t test. Data represent WT (RD, n = 2; HFD, n = 7), Tert−/− (RD, n = 3; HFD, n = 4) and Terc−/− (RD, n = 2; HFD, n = 6) from two independent experiments. **P = .0026; ***P < .001
FIGURE 2
FIGURE 2
Glucose clearance in Tert−/− and WT mice. (A) Blood glucose measurement at time 0–120 min after 50% Dextrose ip injection. (−) or (−) corresponds to Tert−/− (n = 8) or WT (n = 9) mice respectively (also applies to panels b). *P < .05 at time point 30 min. (B) Blood glucose measurement at time 0–90 min after insulin (Humulin) injection (ip). No influence detected in glucose clearance in Tert−/− (n = 4) or WT (n = 7) mice. Error bars indicate mean ±SEM. *P < .05 for the samples compared with WT conditions by Student’s one-tailed t test
FIGURE 3
FIGURE 3
Effects of 15-d HFD and AZT treatment in WT and Terc−/− male mice. Murine serum levels were quantified under RD and HFD conditions: (A) ALT (IU/L), (B) AST (IU/L), (C) cholesterol (mg/dL) and (D) glucose (mg/dL). Murine liver content (mg/g of liver) were quantified under RD and HFD conditions: (E) triglycerides, (F) cholesterol and (G) glycogen. (H) Representative microscopy images of WT and Terc−/− mouse liver sections: H&E or oil red O staining (light microscopy); and DAPI and BODIPY staining (confocal microscopy). Error bars indicate mean ±SEM. *P < .05 for the samples compared with RD conditions by Student’s one-tailed t test. Data represent WT (RD, n = 2; HFD, n = 7; RD + AZT, n = 2; HFD + AZT, n = 7) and Terc−/− (RD, n = 2; HFD, n = 6; RD + AZT, n = 2; HFD + AZT, n = 5) from two independent experiments
FIGURE 4
FIGURE 4
Gene expression profiles in the liver of 6-month- old male mice fed RD and HFD for 15 d. (A) Heat map of hepatic expression of fatty liver genes affected by HFD exposure. Relative levels of gene expression are colour coded: the red or the blue colour represents the highest or lowest level of expression respectively. (B) Fold expression levels of affected genes under HFD conditions in WT, Tert−/− and Terc−/− mouse livers. Results were normalized to WT samples. (C) Heat map of hepatic expression of fatty liver genes from Tert−/− and Terc−/− mouse livers under RD and HFD conditions. (D–E) Fold expression of affected genes. (F) Heat map of Tert−/− and Terc−/− mouse livers under RD conditions. (G) Fold expression of Abca1 and Insr genes. Error bars represent SD. Statistical significance was determined by One-way ANOVA *P < .05; **P < .002. Data represent two mice/group from two independent experiments
FIGURE 5
FIGURE 5
Metabolic analysis in WT, Tert−/− and Terc−/− mouse livers. (A) PCA score plot showing the two first principal components for NMR spectra obtained on chloroform extracts of liver samples from mice under RD and HFD conditions. (B–D) Compounds related to glycogen synthesis. (E–L) Detection of compounds related to glycolysis and pentose phosphate pathway, and (M–P) compounds affecting the TCA cycle under HFD. (Q–T) Amino acid levels in WT, Tert−/− and Terc−/− mouse livers after HFD condition. Error bars represent SD. Statistical significance was determined by one-way ANOVA *P < .05; **P < .001; ***P < .0001. Data represent three mice/group

Comment in

References

    1. Blackburn EH. Switching and signaling at the telomere. Cell. 2001;106:661–673. - PubMed
    1. Blasco MA. Telomere length, stem cells and aging. Nat Chem Biol. 2007;3:640–649. - PubMed
    1. Sahin E, Colla S, Liesa M, et al. Telomere dysfunction induces metabolic and mitochondrial compromise. Nature. 2011;470:359–365. - PMC - PubMed
    1. Greider CW, Blackburn EH. A telomeric sequence in the RNA of Tetrahymena telomerase required for telomere repeat synthesis. Nature. 1989;337:331–337. - PubMed
    1. Cohen SB, Graham ME, Lovrecz GO, et al. Protein composition of catalytically active human telomerase from immortal cells. Science. 2007;315:1850–1853. - PubMed

Publication types

MeSH terms